

How to model critical budget decisions using Prism’s analytical capabilities
Budget questions from leadership are rarely vague. They’re pointed, time-bound, and loaded with consequence.
- “Why are we still spending on brand?”
- “Can we double down on what’s working?”
- “What can we safely cut — today?”
The problem isn’t deciding what to do.
It’s proving why a move makes sense before the money is shifted.
This cheat sheet breaks down the six most common budget simulation scenarios leaders ask for, how to model them using Prism, and how to turn analysis into confident recommendations — without weeks of spreadsheet work.
How to Use This Cheat Sheet
Each scenario includes:
- The leadership ask
- What you need to evaluate
- Prism capabilities that support the analysis
- Example modeling queries
- A decision framework to avoid false positives
Use it as:
- A pre-read before budget reviews
- A weekly optimization checklist
- A fast way to answer “what if” questions with evidence
Scenario 1: Shift Spend Between Campaign Types
“Move budget from Brand awareness to Performance campaigns”
What leaders are really asking
Are brand campaigns just burning money, or are they quietly contributing value we’ll regret cutting?
What to evaluate
- ROAS and CPA by campaign objective
- Spend concentration vs efficiency
- Which brand campaigns are consistently underperforming, not just temporarily soft
How Prism helps
- Cross-platform ROAS and CPA comparisons
- Cost efficiency views that pair spend + outcomes
- Historical comparisons across any two time windows
Modeling queries
- Compare ROAS and CPA across Brand vs Performance campaigns over the last 30 days
- Break down spend distribution by campaign objective and rank by efficiency
- Identify Brand campaigns with ROAS under 2.0 and model a 20% budget reduction
Decision framework
- Use 30-day windows, not weekly snapshots
- Reduce brand budgets incrementally (10–20%), not all at once
- Reallocate only to performance campaigns with stable conversion volume
Output leaders trust
“We can safely reallocate 18% of brand spend without impacting conversion volume, based on 30-day efficiency and declining marginal returns.”
Scenario 2: Scale Winners Without Killing Efficiency
“Double budget on top-performing ad sets”
What leaders are really asking
Can we grow faster without paying more per conversion?
What to evaluate
- Which ad sets are actually delivering (not just enabled)
- Current spend vs audience size
- Signs of early audience saturation
How Prism helps
- Active asset detection (what’s spending and converting)
- Audience size estimation for scaling headroom
- Budget pacing and delivery alerts
Modeling queries
- Rank top ad sets by ROAS over the last 30 days with current spend and audience size
- Identify ad sets with ROAS >4.0 and daily spend below ₹10,000
- Flag saturation signals for top performers
Decision framework
- Scale in steps: +50% → observe → +100%
- Avoid doubling budgets on small audiences
- Watch CPA trends within 72 hours of scaling
Output leaders trust
“Only 6 of the top 20 ad sets can absorb a 2× budget increase without efficiency loss.”
Scenario 3: Cut Losers Without Killing Potential Winners
“What should we pause right now?”
What leaders are really asking
What’s genuinely waste — not just learning?
What to evaluate
- Minimum spend thresholds
- Duration of underperformance
- Trend direction, not just averages
How Prism helps
- Performance thresholds tied to spend minimums
- Multi-week trend analysis
- Creative fatigue signals to separate asset issues from audience issues
Modeling queries
- List campaigns with ROAS <1.5 and spend >₹25,000 over the last 14 days
- Flag ad sets with declining ROAS for 3+ consecutive weeks
- Identify placements driving cost without conversions
Decision framework
- Never cut assets inside their first 7 days
- Require 14 days + meaningful spend before pausing
- Reallocate recovered budget immediately to proven winners
Output leaders trust
“Pausing these assets recovers ₹1.2L monthly with minimal revenue risk.”
Scenario 4: Combat Creative Fatigue Before the Drop
“Creative performance is slipping — what now?”
What leaders are really asking
Can we refresh before results tank?
What to evaluate
- CTR trends, not just ROAS
- Creative age vs performance decay
- Pattern differences between top and bottom performers
How Prism helps
- Creative fatigue monitoring
- CTR trend tracking with week-over-week comparisons
- Visual performance pattern analysis
Modeling queries
- Flag ads with declining CTR week over week and show creative age
- Compare patterns across top 10 vs bottom 10 creatives
- Estimate impact of reallocating 25% budget to fresh variants
Decision framework
- CTR decay usually precedes ROAS decline
- Refresh before performance “falls off a cliff”
- Maintain a rolling creative test budget
Output leaders trust
“Refreshing creatives now prevents a projected 18% ROAS drop over the next two weeks.”
Scenario 5: Optimize Audience Targeting
“We’re too broad — where should spend go instead?”
What leaders are really asking
Which segments are paying for everyone else?
What to evaluate
- ROAS by demographic and device
- Audience overlap and redundancy
- Rising CPC clusters
How Prism helps
- Granular audience performance breakdowns
- Saved audience overlap analysis
- Interest cluster cost trend detection
Modeling queries
- Break down ROAS by age and gender with spend distribution
- Identify overlapping audiences causing redundant spend
- Flag interest clusters with rising CPC and falling CVR
Decision framework
- Cut the worst 20%, not everything below average
- Reallocate to proven segments with volume
- Watch conversion rate stability post-change
Output leaders trust
“Rebalancing targeting improves efficiency without shrinking reach.”
Scenario 6: Rebalance Platform Spend
“Are we spending on the wrong platforms?”
What leaders are really asking
Is one channel quietly dragging overall performance?
What to evaluate
- CPA and ROAS across platforms
- Platform-specific demographic efficiency
- Contribution vs drag on blended results
How Prism helps
- Cross-platform performance comparisons
- Placement and demographic efficiency scoring
- Account-level ROAS analysis
Modeling queries
- Compare ROAS, CPA, and spend across Meta, Google, and TikTok over 60 days
- Identify platforms delivering lowest CPA by segment
- Model a 15% budget reduction from underperforming platforms
Decision framework
- Use 60-day windows to smooth volatility
- Reduce gradually, not abruptly
- Maintain diversification to avoid dependency risk
Output leaders trust
“A 15% shift improves blended CPA without increasing volatility.”
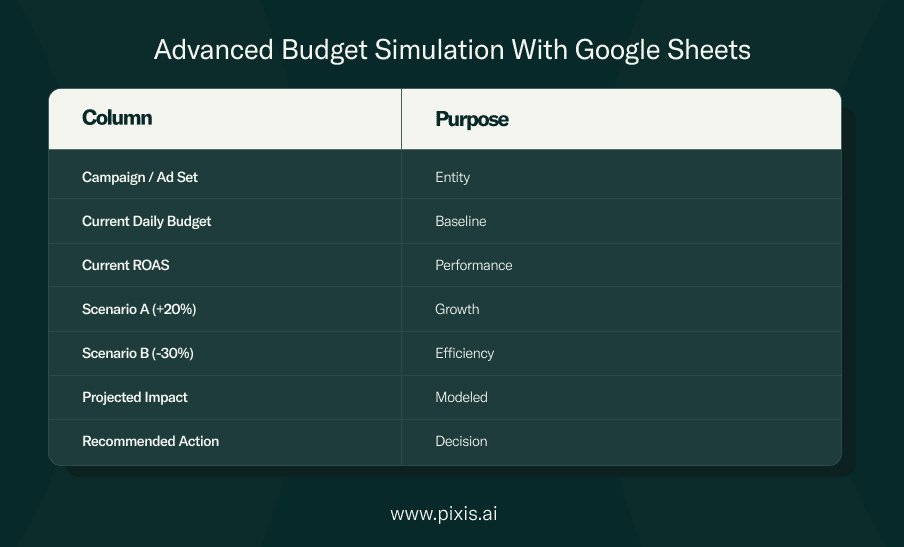
Workflow
- Pull performance data from Prism
- Model scenarios in Sheets
- Compare outcomes
- Validate assumptions back in Prism
- Share a single, defensible recommendation
Simulation Best Practices (Non-Negotiable)
- Always enforce minimum spend thresholds
- Check audience saturation before scaling
- Use 14-day windows for cuts, 30–60 for reallocations
- Evaluate cross-platform impact, not siloed gains
The Bottom Line
Most budget waste doesn’t look dramatic.
It accumulates quietly — until it shows up in a report you can’t undo.
This cheat sheet exists so leaders don’t have to ask after the fact.
And teams don’t have to guess.
Prism makes the simulations fast. The judgment still belongs to you.