

When campaign performance changes unexpectedly, the first question is always "why?"
And not just the event that catalyzed the change, but the reason behind that - the root cause of the issue. That's where the insights you can act on are hiding.
Why did CPA spike, but only in Texas?
Why did ROAS drop after weeks of steady results?
Why did conversion rate suddenly increase when spend stayed the same?
When I worked at an agency for a few years early in my career, my clients often asked me questions like that. They threw them out there, like they were just idly wondering. Meanwhile here's me, sweating because I know it's going to take me four hours just to get the data I need to even start to answer the question...
Thankfully around that time I started and MBA (never finished it - long story) and learned about Root Cause Analysis (RCA) frameworks, and started to apply them to my work at the marketing agency.
Root Cause Analysis 101 – The Frameworks Marketers Should Know
As the name suggests, root cause analysis (RCA) is the process of identifying the real reason something happened, not just the surface-level symptom. Marketers usually run into these frameworks:
The 5 Whys
Just ask “why?” repeatedly until you get to the underlying cause. As a general rule, five times gets you there. It looks like this in practice:
- "Why did CPA drop?"
"Because Texas brought the average down. Everywhere else was fine." - "Why?"
"Because in Texas, the CTR dropped." - "Why?"
"The CTR average dropped statewide mostly because Austin brought the average down." - "Why?"
"The CTR dropped in Austin because Campaign A stopped performing, but spends most of its budget in the Austin DMA." - "Why did Campaign A stop performing?"
"Creative fatigue."
So it's simple. At least on the surface. It can look nice and linear when I give you an example like that. But it does kind of hide the potential for complexities and rabbit-holes. For example, just in asking why the CTR dropped in Texas, you'd still need to look at bids, budgets, audiences, creative, competitors, maybe the news, algorithm changes...
Another potentially huge weakness or risk of the 5 why's framework is that it presumes ONE root cause, which in reality is almost never the case.
I use the 5 why's more as a mindset than an applicable framework most of the time. Helpful to know, hard to apply.
Ishikawa / Fishbone Diagram
This one is a visual method for mapping possible causes. It's awesome for brainstorming, and it helps you consider the many potential causes of a change in performance. Here's what it looks like:
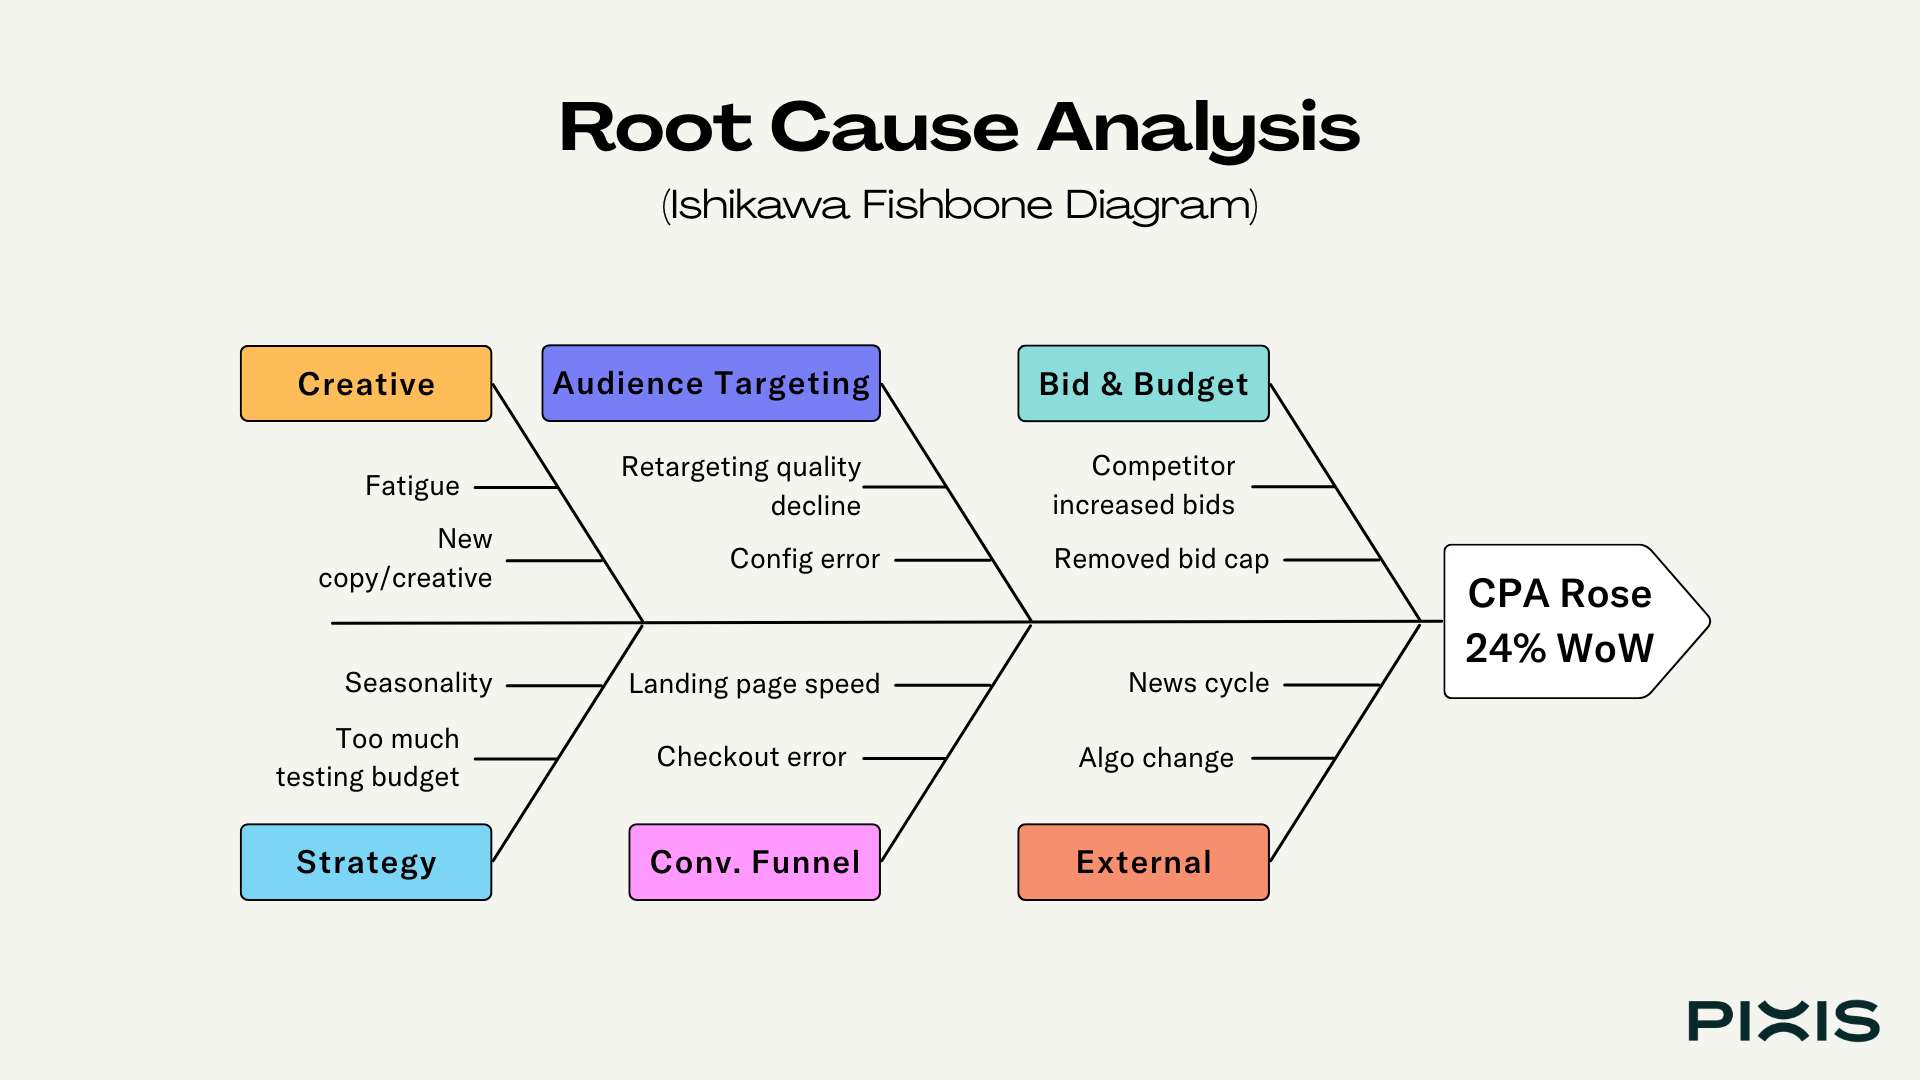
This one sort of stops helping after you brainstorm. It's not useful for ruling things out.
Beyond those two most popular RCA frameworks, there's fault tree analysis, Pareto charts — but for performance marketing, you rarely have the luxury of weeks-long deep dives. You need a version that works at campaign speed.
That’s why the fastest way to get clarity is to think in terms of four levers:
- Audience – who sees the ad
- Creative – what they see
- Bids – what you pay per action (click, view, conversion ,etc.)
- Budget – how much you spend total, and where you spend it
You'll notice these are also represented in the fishbone chart above. But I removed strategy and external forces for the time being, since those are sometimes not levers we can pull.
If you can measure, analyze, and adjust these four elements effectively, you control your campaign performance. Everything else is a distraction.
And that's why I built my method around those. There's a little bit of fishbone. A bunch of "whys". But because I focus on interrogating each of the four levers within reach, I think this helps get beyond the academic and into solutions-territory faster.
Here's how to do a root cause analysis in performance marketing:
Step 1: Break Down Your Four Levers
First step in a performance marketing-specific root cause analysis is to break it down into questions that fall into each of those four categories. List everything that's possible in your context.
Back to our example.
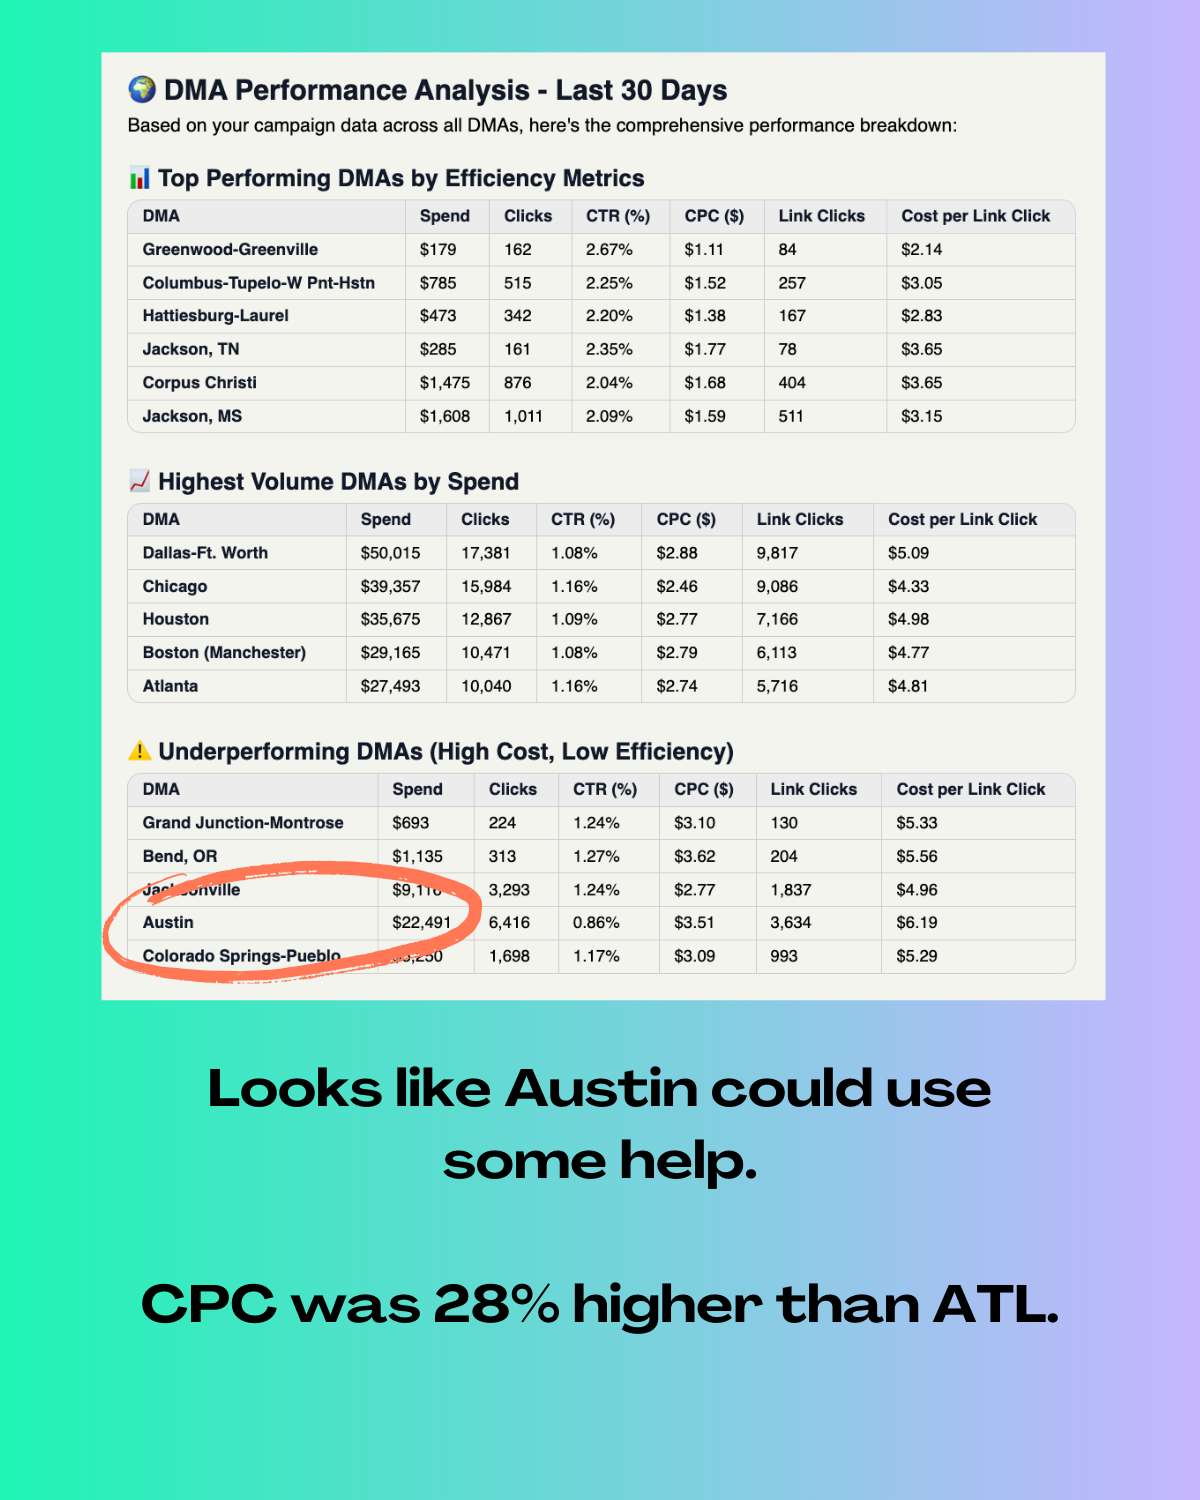
“Why was my CPA high in Austin last month?”
Broken down, this becomes:
Audience
- Did targeting shift to a higher-cost segment?
- Was there audience overlap with another campaign?
- Did frequency spike, hurting conversions?
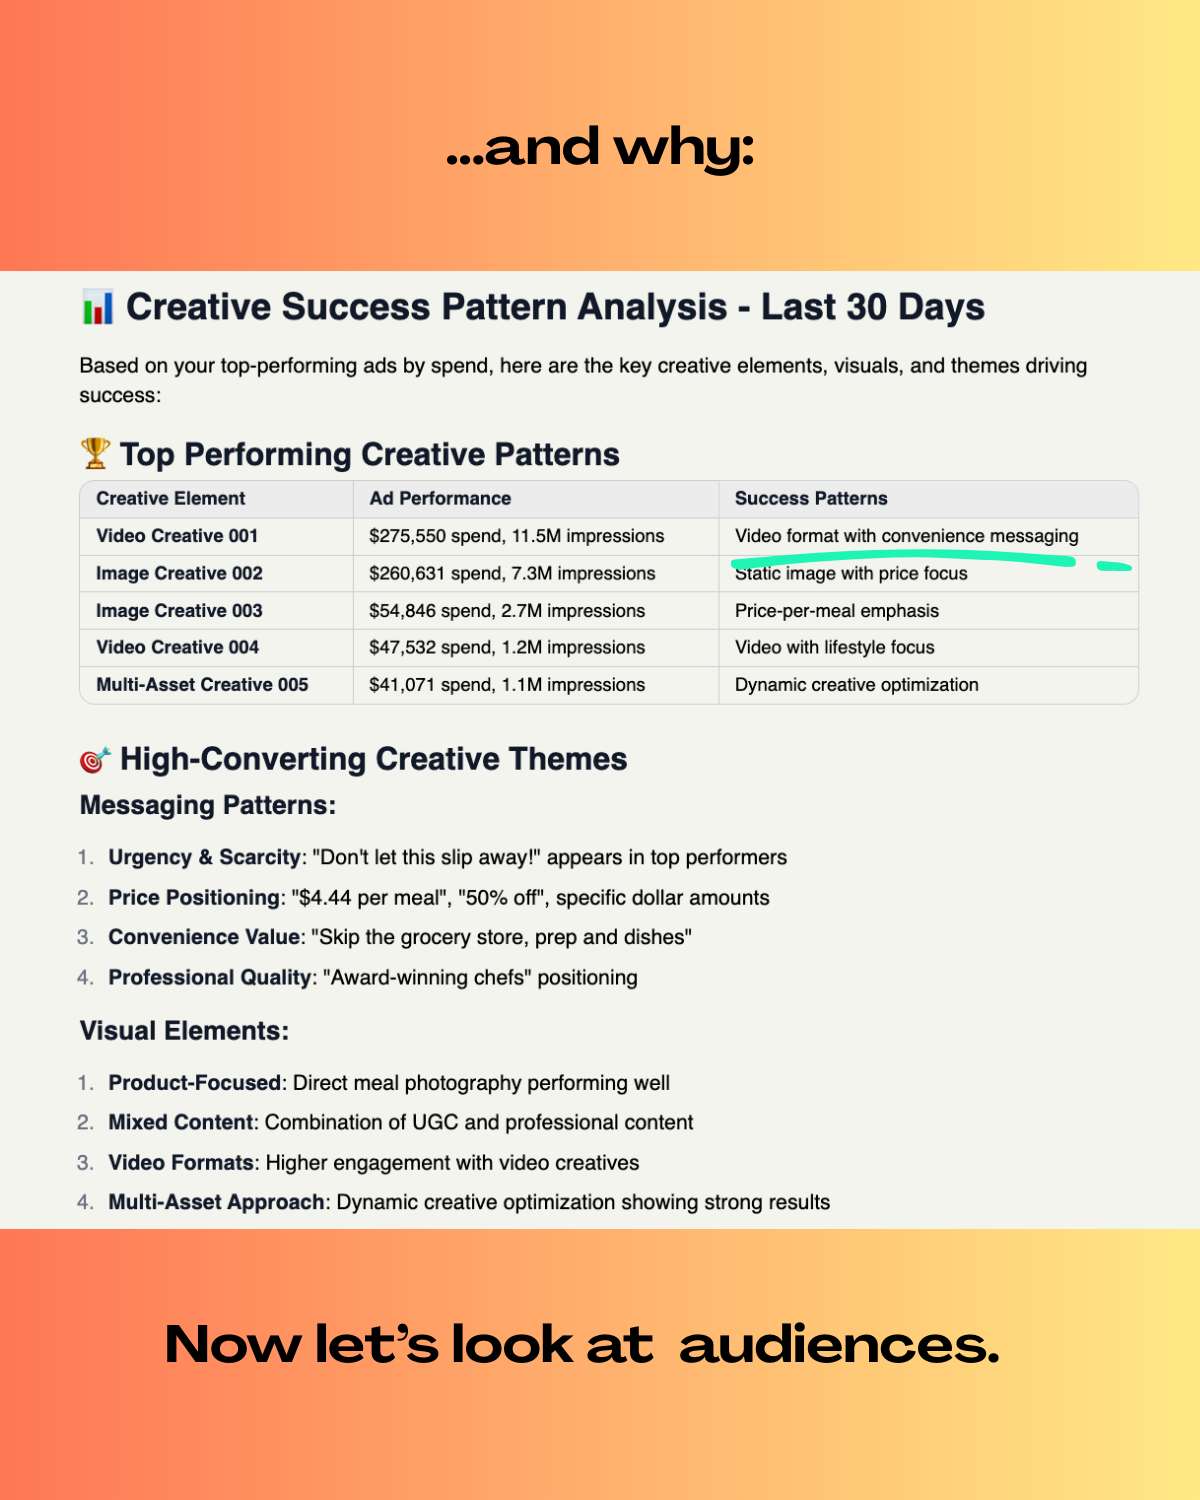
Creative
- Did top-performing ads lose impression share?
- Was creative fatigue setting in?
- Was the messaging mismatched to that location or audience segment?
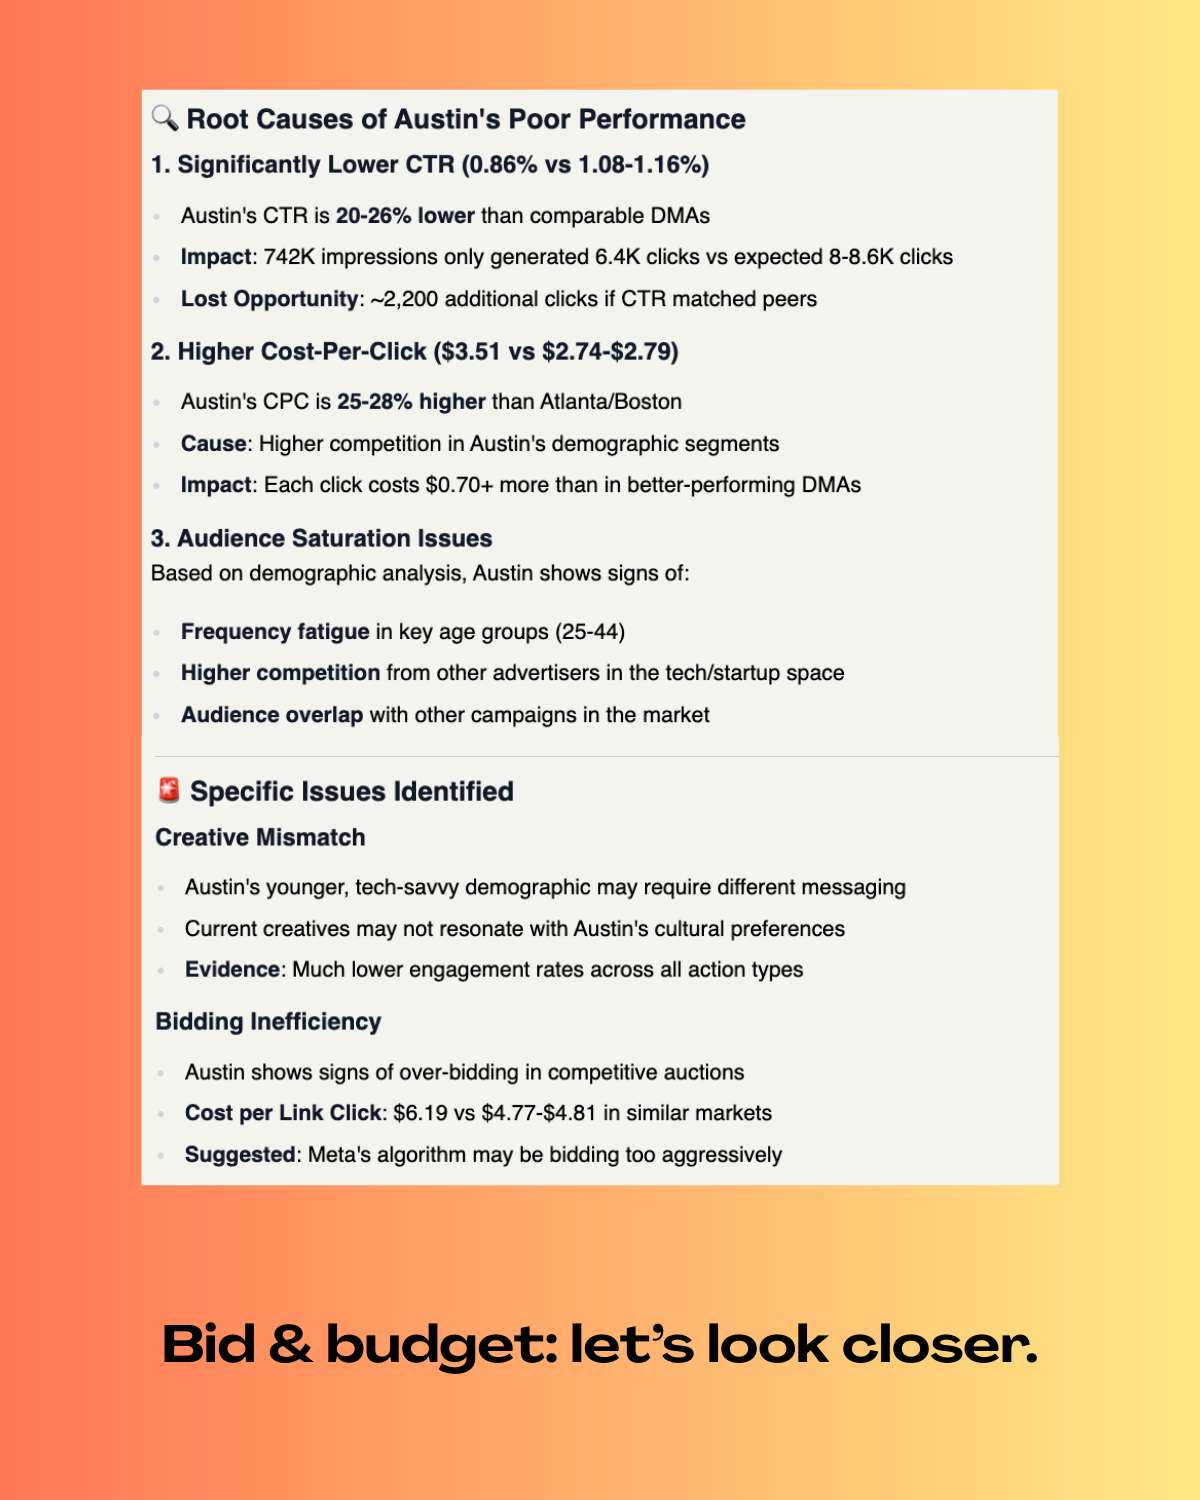
Bids
- Were bid strategies or targets changed mid-campaign?
- Did competitor activity push CPCs higher?
- Were bid caps too restrictive?
Budget
- Was budget reallocated mid-flight?
- Did pacing shift to less effective time slots?
- Did weaker segments get more spend than top converters?
Pro-tip: this step, where you're just brainstorming potential causes is a great time to use an LLM.
These questions help you capture the possibilities, but also make those possibilities specific enough to actually address.
Plus, at this point, you can identify which questions you won't even be able to answer at all. Highlight them, cross them out, write them in your diary - just don't spend time trying to answer questions you won't be able to answer.
So you've got a list of questions, and you've narrowed it down to questions you can actually answer. Congrats! You're about to start step 2.
Step 2: Attribute Variance
Now you can work through answering each question. Some are hard. Some are easy. I recommend just starting with what you believe is most likely (not the meatiest, not the easiest - the most probable).
Once you answer one question that illuminates something, you can decide if it was significant enough of a driver to explain the whole shift, or just one of many contributing factors.
If it looks like it was just one of many, keep working your way through the list from most-likely to least. Assign a value of contribution to each sub-cause.
Also, make sure you use a relevant baseline for comparison—this might be the average performance from the previous three months or the same period last year if seasonality is a factor. Then break down the variance in your key metric, such as CPA, into contributions from Audience, Creative, Bids, and Budget.
For example, you might discover that:
- a shift toward a younger audience segment with lower conversion rates added $1.2 to CPA.
- reduced distribution of two top-performing creatives added $0.27.
- an increase in your target CPA added another $0.84.
I'm not making an argument that these are completely independent factors. It could be that the shift towards the younger audience segment also led to lower distribution of your previous top-performers.
But by quantifying the approximate impact of each factor, you avoid guesswork and create a clear picture of where the problem is rooted.
And of course, there's nobody saying you absolutely have to do this piece (assigning actual value). But I've found that by keeping record of the measurable impact each sub-cause had, it's helped me diagnose more quickly and avoid more pitfalls in the future.
In other words, it helps me learn more.
Step 3: Isolate the Biggest Drivers
Once you have quantified the impact of each lever, the next step is to focus on the ones that matter most and that you actually have the ability to control.
This is about prioritization—chasing minor contributors wastes resources and dilutes focus. At the same time, trying to convince your leadership that their entire strategy to appeal to younger audiences needs to change might be a losing battle.
And because of that, this is kind of an art. By the time you've got a list of potential contributing factors, you probably already know which ones you can actually control. But it's worth calling this out as a step, since some people think ALL problems must be solved. They don't.
Step 4: Test Counterfactuals
Now you can run counterfactual scenarios to understand what would have happened if those factors had not changed. This step turns diagnosis into prediction. For example, use historical data to model CPA under the assumption that the creative mix stayed constant, or that the audience didn't shift, or bid targets were left unchanged.
You might find that restoring the previous creative mix and reverting bid targets could recover 80% of the lost efficiency without altering audience targeting at all.
Counterfactuals let you evaluate multiple “what if” options before committing to a change, reducing the risk of making adjustments that won’t deliver meaningful results.
Step 5: Translate into Action
The final step is to convert your findings into a targeted, time-bound action plan. This plan should directly address the drivers you’ve identified, specify the changes to be made, and set clear performance expectations.
If creative fatigue is the main culprit, your plan might include reactivating past top-performing creatives with subtle copy or design tweaks, running A/B tests on replacements, and setting impression share monitoring to avoid repeat losses.
If bids are the issue, you might revert to the prior target, adjust caps, or introduce competitive monitoring to avoid future spikes. The key is to make the plan specific enough that your team can execute it without ambiguity and measurable enough that you can track its effectiveness.
In short - document. This is the step most people skip, but it is arguably the most important of them all. If you learned something, and you don't write it down, you may waste experiment cycles or ad dollars in the future, re-learning it. And if you don't commit to a plan to improve CPA, you're likely to get distracted by the next "urgent" ask that flies your way.
Or, Let Prism Do These Steps for You
Running a full root cause analysis manually means switching between dashboards, exporting CSVs, reconciling metrics, and manually testing scenarios. It works, but it’s slow.
We're fortunate enough to have our own product to use with this. It's called Prism, and it's an LLM created specifically for performance marketing. Since it has direct access to all the relevant data it needs to do the analyses, you can use Prism to run this same five-step process in a single conversation.
Prism connects directly to your ad accounts and analytics platforms, so it can attribute variance across Audience, Creative, Bids, and Budget; isolate the biggest drivers with exact percentage impact; model counterfactual scenarios in real time; and deliver a ready-to-execute action plan—all without leaving the chat.


With a few simple prompts, you get the same level of detail as the manual method—but faster, cleaner, always up to date, and documented.
Why this matters for scaling campaigns
When you consistently evaluate performance through the lens of Audience, Creative, Bids, and Budget, you:
- Find issues faster
- Avoid wasted spend on low-impact changes
- Create clear, evidence-backed action plans
- Make informed optimizations that scale across markets
Key takeaway
Performance marketing will always have moving parts, but the root cause of most swings can be traced back to one or more of the four levers.
A disciplined root cause analysis turns scattered metrics into clear, actionable insights, so you can pull the right lever at the right time. Whether you run this process manually or let Prism handle it for you in real time, the principle is the same: clarity before action, and action that moves the metrics that matter.