

If you’ve ever opened your dashboards and seen Google Ads boasting 4.2 ROAS while GA4 insists it’s closer to 1.8, you know the sinking feeling that follows. Suddenly, the most essential question in performance marketing—“Is my spend paying off?”—turns into a mess of conflicting numbers.
These discrepancies cut right to the heart of budget decisions. Which number do you trust when deciding whether to scale a campaign, cut spend, or defend results to a client or CFO?
And if you’re running Performance Max, the problem only multiplies. The bigger the spend, the worse GA4 looks. I’ve seen accounts where Google Ads happily reported strong returns while GA4 suggested campaigns were bleeding money— at a 85% ROAS gap. At first glance it feels chaotic, but the truth is these gaps aren’t random. They’re predictable, repeatable, and diagnosable.
That’s the mindset shift that changed how I approach this problem: stop treating GA4 vs Google Ads discrepancies as “bad data,” and start treating them as different versions of the truth. Once you understand why the numbers don’t match, you can decide when to trust each—and even better, build a framework to fix the mess before it derails your reporting.
Why the Numbers Never Match
The frustrating part is this: nothing’s “broken.” Your Google Ads and GA4 numbers don’t disagree because of a glitch—they disagree because they’re built on different philosophies of measurement. Once you see those philosophies in action, the discrepancies stop feeling random and start making sense.
1. Attribution Model Conflicts
Google Ads attributes full credit when an ad is part of a conversion path. On the other hand, GA4 evaluates all channels in a conversion path and distributes credit accordingly.
Real scenario I see constantly:
- Customer clicks my "running shoes" ad → browses, doesn't buy
- Three days later, searches "Nike running shoes" organically → purchases ₹5,000
- Google Ads: Credits ₹5,000 to paid search
- GA4: Credits ₹5,000 to organic (zero to Google Ads)
This single attribution difference explains why my Performance Max campaigns show massive discrepancies.
2. Timing Attribution Issues
This isn’t about who gets credit (that’s attribution modeling), it’s about when the credit shows up in your reports.
- Google Ads’ rule: a conversion is tied back to the day the ad was clicked.
- GA4’s rule: a conversion is tied to the day the purchase actually happened.
Here’s why that matters: imagine a user clicks your ad on September 20th, but doesn’t buy until October 5th.
- Google Ads view: “That’s a September conversion” (because that’s when the ad click happened).
- GA4 view: “That’s an October conversion” (because that’s when the money was actually spent).
If your typical delay from click to purchase is around 10–15 days, these platforms will constantly shift revenue into different months. September will look better in Google Ads, October will look better in GA4, and you’ll be left explaining “phantom spikes and dips” that are really just timing differences.
The key distinction:
- Attribution models decide who gets credit for the conversion.
- Timing attribution decides when the conversion gets counted.
Both matter — and both create gaps if you don’t account for them.
3. Conversion Tracking Scope Differences
Google Ads tracks signals GA4 completely misses:
- View-through conversions (users who saw but didn't click)
- Modeled conversions (estimated when cookies blocked)
- Cross-device conversions (mobile ad → desktop purchase)
- YouTube engagement driving website conversions
Ad blockers: Some users employ ad blockers that can prevent the tracking codes from firing, leading to underreported traffic in Google Analytics, affecting 25-40% of my traffic.
Weekly ROAS Audit Process (Manual Framework)
A weekly audit isn’t about catching random errors — it’s about spotting patterns before they derail your reporting. I break it into three clear phases: collecting data, analyzing patterns, and acting on the insights.
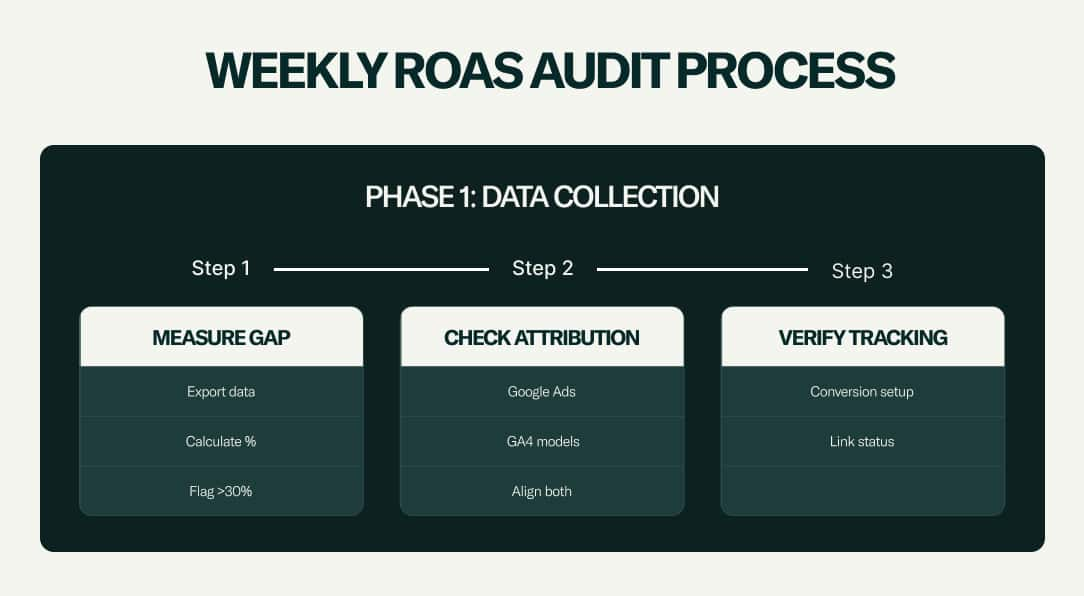
Phase 1:
Data Collection is all about getting the numbers straight before jumping to conclusions. I start by measuring the ROAS gap between Google Ads and GA4 on identical date ranges. If the difference is significant enough to impact budget decisions, I know it's worth investigating.
From there, I check attribution models—Google Ads often defaults to Data-driven while GA4 sits on Paid + Organic Last Click. If these don't align, the discrepancy is already explained.
Finally, I verify that conversions are correctly mapped and that the Google Ads–GA4 link is live. Without this basic hygiene, nothing else matters.
Google Ads Attribution Settings: Tools & Settings → Conversions → select conversion action → Edit Settings → Attribution model (set at conversion action level)
GA4 Attribution Settings: Admin → Attribution Settings (affects entire property)
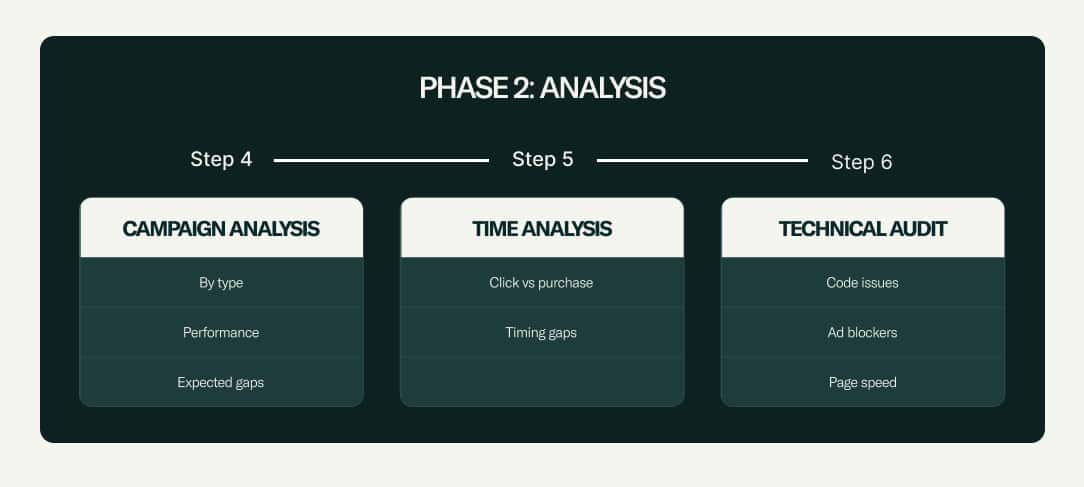
Phase 2:
Analysis is where I diagnose the "why" behind the gap. I break performance down by campaign type since each carries its own expected variance patterns.
Not every campaign type should be judged by the same yardstick:
- Search campaigns usually show smaller gaps, so I only investigate when differences spike significantly higher
- Performance Max consistently shows the widest variance, so I rely on Google Ads data for optimization but turn to GA4 for budgeting decisions
- Shopping campaigns typically show moderate variance, which I treat as normal
- Display campaigns often show larger gaps because of view-through conversions
Then I look at timing mismatches—Google Ads logs conversions at the click date, while GA4 waits for the actual purchase date, creating artificial monthly swings.
Finally, I run a technical audit on top landing pages. GA4 tags failing to fire, JavaScript errors, ad blockers, or even slow page loads can all distort what GA4 sees versus what Ads reports.
Phase 3: Decision
Once the data is collected and the patterns are analyzed, the final step is deciding what to actually do with the numbers. This phase is less about diagnostics and more about judgment calls: knowing which platform to trust, when to trust it, and how to act on what you see.
I start with a cross-device check, because attribution chaos often hides in the customer journey itself. A user might click an ad on mobile but complete the purchase on desktop, which Google Ads can often stitch together while GA4 misses entirely.
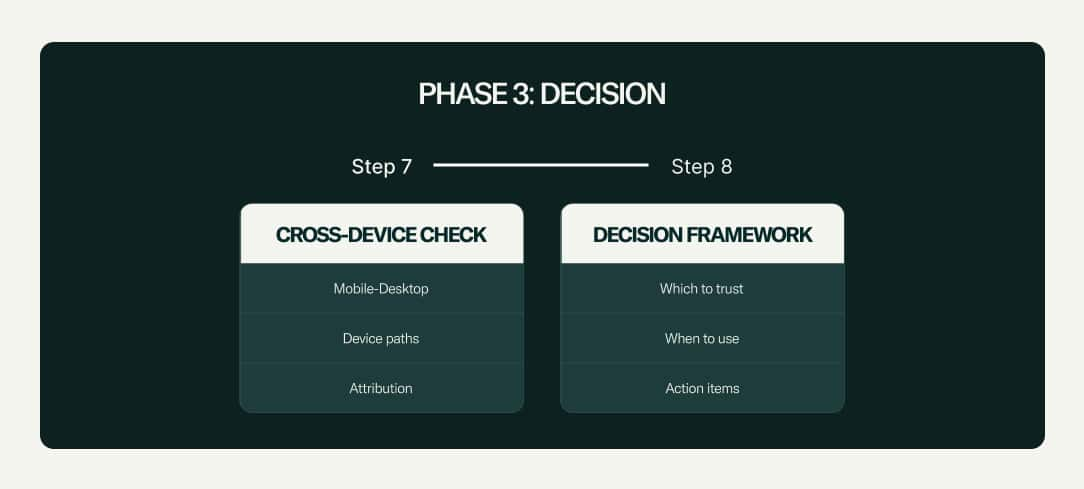
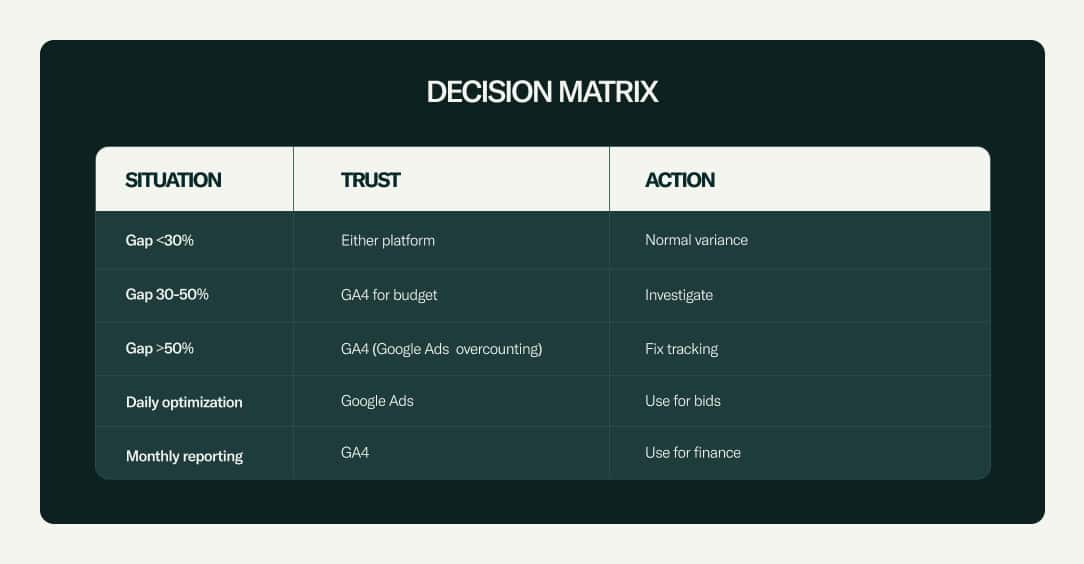
From there, I move into the decision framework. My approach:
- Small gaps: Treat as normal variance and don't overreact
- Moderate gaps: Use GA4 for budget planning but keep digging for causes
- Large gaps: Assume Google Ads is overcounting and focus on fixing tracking issues
For daily optimization, Google Ads remains my go-to since its real-time data fuels bidding. For monthly reporting and financial forecasting, GA4 is more reliable because it reflects actual recorded sales across channels.
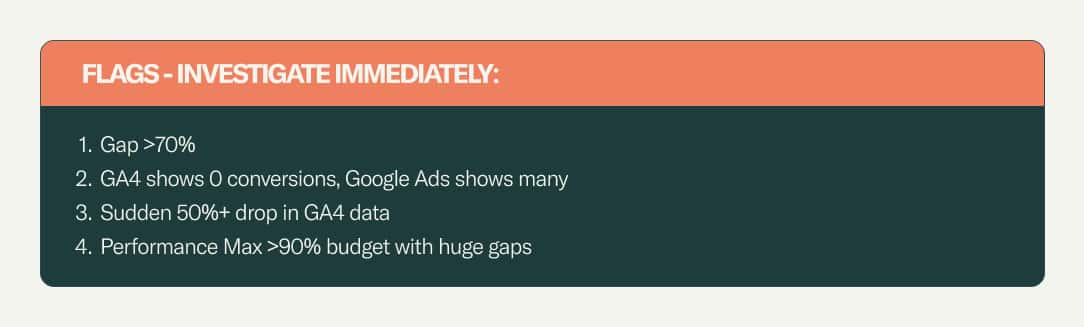
Some red flags demand immediate investigation:
- Massive ROAS gaps (Google Ads showing very high while GA4 shows very low)
- GA4 showing zero conversions while Google Ads shows plenty
- Sudden large drops in GA4 data
- Performance Max consuming most of spend with massive attribution gaps
At the end of this phase, the goal isn't to crown one platform as "right" and the other as "wrong." It's about assigning trust strategically: Google Ads for tactical moves, GA4 for financial truth, and my own judgment to reconcile the two.
At the end of this phase, the goal isn’t to crown one platform as “right” and the other as “wrong.” It’s about assigning trust strategically: Google Ads for tactical moves, GA4 for financial truth, and my own judgment to reconcile the two. That way, discrepancies stop being roadblocks and become inputs for smarter decisions.
The Single Source of Truth Question
Let me address the elephant in the room: everybody wants a single source of truth. There are platforms like Triple Whale, Northbeam, Hyros, and other attribution tools that promise to deliver accurate attribution across all channels by combining first-party data with advanced modeling. These solutions can absolutely work—if you have the budget for them (typically $500-2,000+ monthly) and the time for proper implementation.
But if you don't have budget for dedicated attribution platforms, or if you want to understand what's happening before investing in one, here's how you can figure it out yourself using the tools you already have.
Automating This with Prism
The 3 phase manual framework works, but it takes me 2-3 hours weekly per account. For agencies or larger spends, Prism by Pixis automates this entire process.
What Prism Actually Does
Instead of manual data exports, Prism pulls real-time data from:
- Google Ads (all campaign types)
- GA4 (complete attribution data)
- Facebook/Meta Ads
- Revenue systems (Shopify, CRM, etc.)
Real-time alerts when:
- Platform discrepancies exceed your thresholds
- Attribution conflicts arise
- Technical tracking issues are detected
Manual vs Prism Reality
The manual process requires 2.5 hours weekly with only periodic snapshots, manual spreadsheet calculations, and my own interpretation of the data—meaning I often discover issues weeks after they occur. Prism flips this entirely: automated monitoring replaces manual work, real-time alerts replace weekly snapshots, instant analysis replaces spreadsheet calculations, AI recommendations replace my guesswork, and immediate notifications replace delayed discovery.
Before Prism: 4-5 weeks to identify and fix attribution problems
With Prism: Problem identified and resolved within a few hours
When I Use Each Approach
Manual Framework: Small accounts, infrequent discrepancies, learning the process
Prism: Multiple accounts, >$50k monthly spend, need real-time insights
The Reality Check
If your Google Ads ROAS looks too good to be true, it probably is. Once you start looking at the full journey, not just last click attribution, the picture becomes clearer.
The goal isn't choosing one platform over another—it's understanding what each tells you and using the right data for the right decisions.