

I’ve been in performance marketing long enough to know that nothing feels better than watching a single ad outpace everything else. Costs drop, conversions climb, dashboards glow green—and suddenly, the whole team is asking if we can “just do more of that.” It feels like striking gold.
But I’ve also learned that gold can be fool’s gold. One ad’s success might come from a killer hook, or it might just be the algorithm dealing you a lucky hand. Without digging deeper, I can’t tell the difference. And if I can’t tell the difference, I can’t repeat the win. That’s when growth turns into gambling—every new campaign is another roll of the dice.
What separates sustainable growth from lucky streaks is the ability to reverse-engineer success. Over time, I’ve built a process for breaking down these outliers, turning one-off spikes into playbooks I can trust. Let me walk you through how I do it.
Step 1: Start with the basics
I call it the basics because they’re exactly that—the first layer of truth. Whenever an ad takes off, I pull up three metrics side by side with my campaign averages:
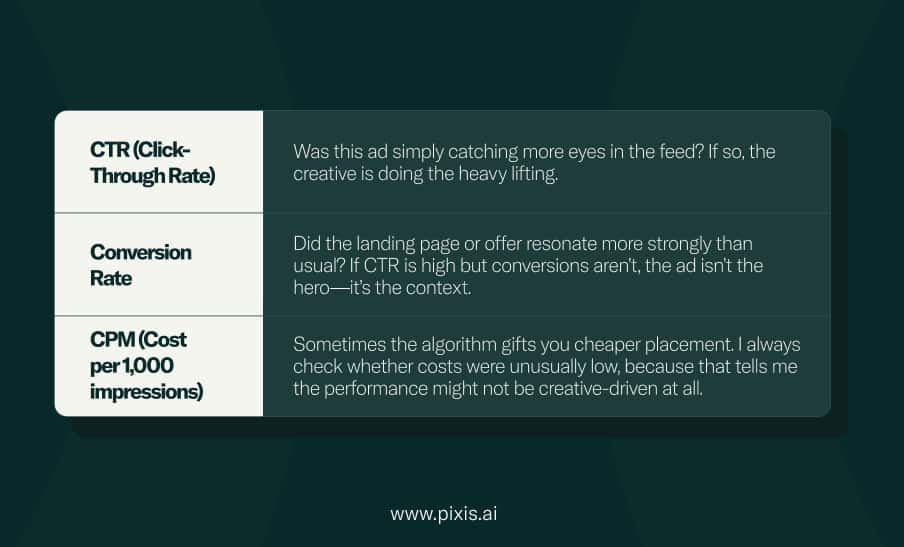
For example, I once had an ad with sky-high CTR, but when I dug in, conversions were flat. Turned out the creative was clicky, but the landing page message didn’t line up. Without checking that layer, I would have wrongly crowned the ad a hero.
This first layer helps me avoid over-crediting the ad when something else was at play.
Step 2: Break down the audience
Next, I want to know who made the ad work. Averages lie, segments don’t.
- I slice performance by age, gender, and geography. More often than not, one sub-group is carrying the result.
- I look for overlaps with other campaigns. Did this ad hit an untapped audience, or did it double down on a segment we’d already warmed up elsewhere?
- I always check frequency. A high-performing ad at low frequency usually signals freshness. A high-performing ad at high frequency suggests it has real staying power.
This is where insights turn into targeting decisions for the next round.
Step 3: Study the creative in detail
I’ve learned to treat the creative like a crime scene. Every element gets inspected:
- Format: Was it a carousel, static, or video? If video, what was the drop-off point?
- Hook: Did the first line in the caption or first three seconds of the video grab attention immediately?
- Visual style: Was it polished, UGC-style, humorous, or aspirational?
- CTA placement: Was the call-to-action in the first line, middle, or end?
I don’t just look at what’s in the ad—I compare it against my underperformers. The contrast is often more revealing than the content itself.
Step 4: Examine timing and context
Even the sharpest creative can tank if the timing’s wrong. That’s why I always step back to ask:
- Did this run alongside a holiday, sale, or cultural moment that primed audiences to convert?
- Was there a competitive lull where I had the spotlight? Sometimes winning is as much about when as what.
- Were there platform shifts at play? For example, Meta occasionally over-delivers certain formats for weeks at a time.
Context explains why some “winners” don’t stay winners when I rerun them later.
Step 5: Layer in cross-channel signals
The ad may be the hero, but it rarely works alone. I cross-check data from:
- Google Analytics or Appsflyer: Did users click the ad but convert after another channel touch?
- Search and branded queries: Did impressions spike in search during the campaign?
- Organic social or email: Were we reinforcing the same message elsewhere?
I’ve had ads that looked like they carried the whole win—until I noticed branded search was spiking at the same time. The ad wasn’t just converting; it was creating demand that people then fulfilled through search.
A campaign that looks like an isolated win often turns out to be the final push in a larger ecosystem.
Step 6: Codify the learnings
Once I’ve mapped the “why,” I don’t leave it as a mental note. I build it into a playbook. That means documenting:
- The creative traits that worked (e.g., humor, short captions, close-up visuals).
- The audience segment that mattered.
- The contextual factors (timing, spend levels, supporting channels).
This way, the next ad isn’t guesswork—it’s built on patterns.
Step 7 a.k.a. Alternate Step: Let AI do the heavy lifting
The alternate to manually piecing this together is leaning on tools that already sit across your ecosystem. With Prism, for example, all my performance data—from Meta to Google to Appsflyer—is already plugged in. That means instead of exporting reports and cross-checking tabs, I can see exactly which levers (audience, creative, bids, budgets) drove the outcome, across channels, in one view.
This is where I find the difference between a generic LLM and a purpose-built; marketing specific LLM platform like Prism. A generic model can describe patterns if I feed it data; Prism already has the data integrated and can surface the specific correlations that matter to performance marketers. In practice, it means I spend less time reconciling spreadsheets and more time designing repeatable wins.
Final thought
Every winning ad leaves behind a trail of breadcrumbs. If I follow them carefully—across metrics, audience, creative, context, and channels—I can turn one lucky hit into a repeatable playbook.
That’s how I move from chasing wins to designing them. And in performance marketing, that’s the difference between growth that scales and growth that stalls.