

You check your ad dashboard and see numbers everywhere. Impressions, clicks, conversions, ROAS—but which ones actually tell you if your campaigns are working?
Most marketers track too many metrics or focus on the wrong ones. The result: wasted budget on campaigns that look good on paper but don't drive revenue. This guide breaks down the metrics that matter, how to calculate them, and when to act on what they're telling you.
What advertising metrics really mean and why they matter
Advertising metrics are data points that show how your campaigns perform. Return on ad spend (ROAS) and cost per acquisition (CPA) matter most because they measure profitability directly. They tell you whether your ad dollars turn into actual revenue.
Other metrics like conversion rate, click-through rate, and impressions measure different parts of the journey. Conversion rate shows what percentage of visitors complete an action, while click-through rate reveals ad engagement. Impressions count how many times your ad appeared on screen.
The metrics that matter most depend entirely on your goal. For brand awareness campaigns, focus on reach and impressions. For direct sales, watch ROAS and CPA like a hawk.
The core metrics every modern marketer tracks by funnel stage
Different parts of the customer journey require different metrics. At the top of the funnel you measure visibility, in the middle you track interest, and at the bottom you count conversions.
Organizing metrics by funnel stage keeps you focused on what actually matters at each point. It also stops you from optimizing for the wrong thing—like celebrating high click-through rates when you actually need purchases.
Awareness metrics
Impressions measure how many times your ad appeared. Reach counts unique people who saw it at least once. The difference matters: 10,000 impressions might mean 10,000 people saw your ad once, or 1,000 people saw it 10 times.
CPM (cost per thousand impressions) shows what you pay to get your ad in front of 1,000 people. Lower CPMs mean you're reaching more people for less money. This metric becomes critical when your goal is visibility, not immediate conversions.
Frequency tracks the average number of times someone saw your ad. Too low and your message doesn't stick. Too high and you're annoying the same people repeatedly.
Consideration metrics
Click-through rate is the percentage of people who clicked after seeing your ad. Low CTR usually signals that your targeting missed the mark or your creative doesn't resonate.
Cost per click measures what you pay each time someone clicks. You calculate it by dividing total spend by total clicks. Lower CPCs mean you're driving traffic more efficiently, though cheap clicks that don't convert still waste money.
Engagement rate captures likes, shares, comments, and other interactions. High engagement suggests your content sparked genuine interest, even if people didn't click through immediately.
Conversion metrics
Conversion rate is the percentage of visitors who complete your desired action. It's one of the clearest signals of whether your campaign actually works.
Cost per acquisition calculates the total cost to acquire one customer. Divide total spend by conversions. If your CPA exceeds your profit per customer, you're losing money on every sale.
Return on ad spend measures revenue generated for every dollar spent. A ROAS of 4:1 means you earned $4 for every dollar spent. This metric tells you whether your campaigns are profitable, period.
Retention and LTV metrics
Customer lifetime value estimates total revenue a customer generates over their entire relationship with your brand. Calculate it by multiplying average order value by purchase frequency by average customer lifespan.
Repeat purchase rate shows what percentage of customers buy again. High repeat rates mean your acquisition dollars have staying power. Low rates mean you're constantly chasing new customers instead of keeping existing ones.
LTV determines how much you can afford to spend on acquisition. If a customer is worth $500 over their lifetime, spending $100 to acquire them leaves room for profit.
How to calculate each metric without spreadsheet gymnastics
Most ad platforms calculate metrics automatically. But knowing the formulas helps you spot errors, customize reports, and make faster decisions.
1. Click-through rate formula
CTR equals clicks divided by impressions, times 100. If your ad got 50 clicks and 10,000 impressions, your CTR is 0.5%.
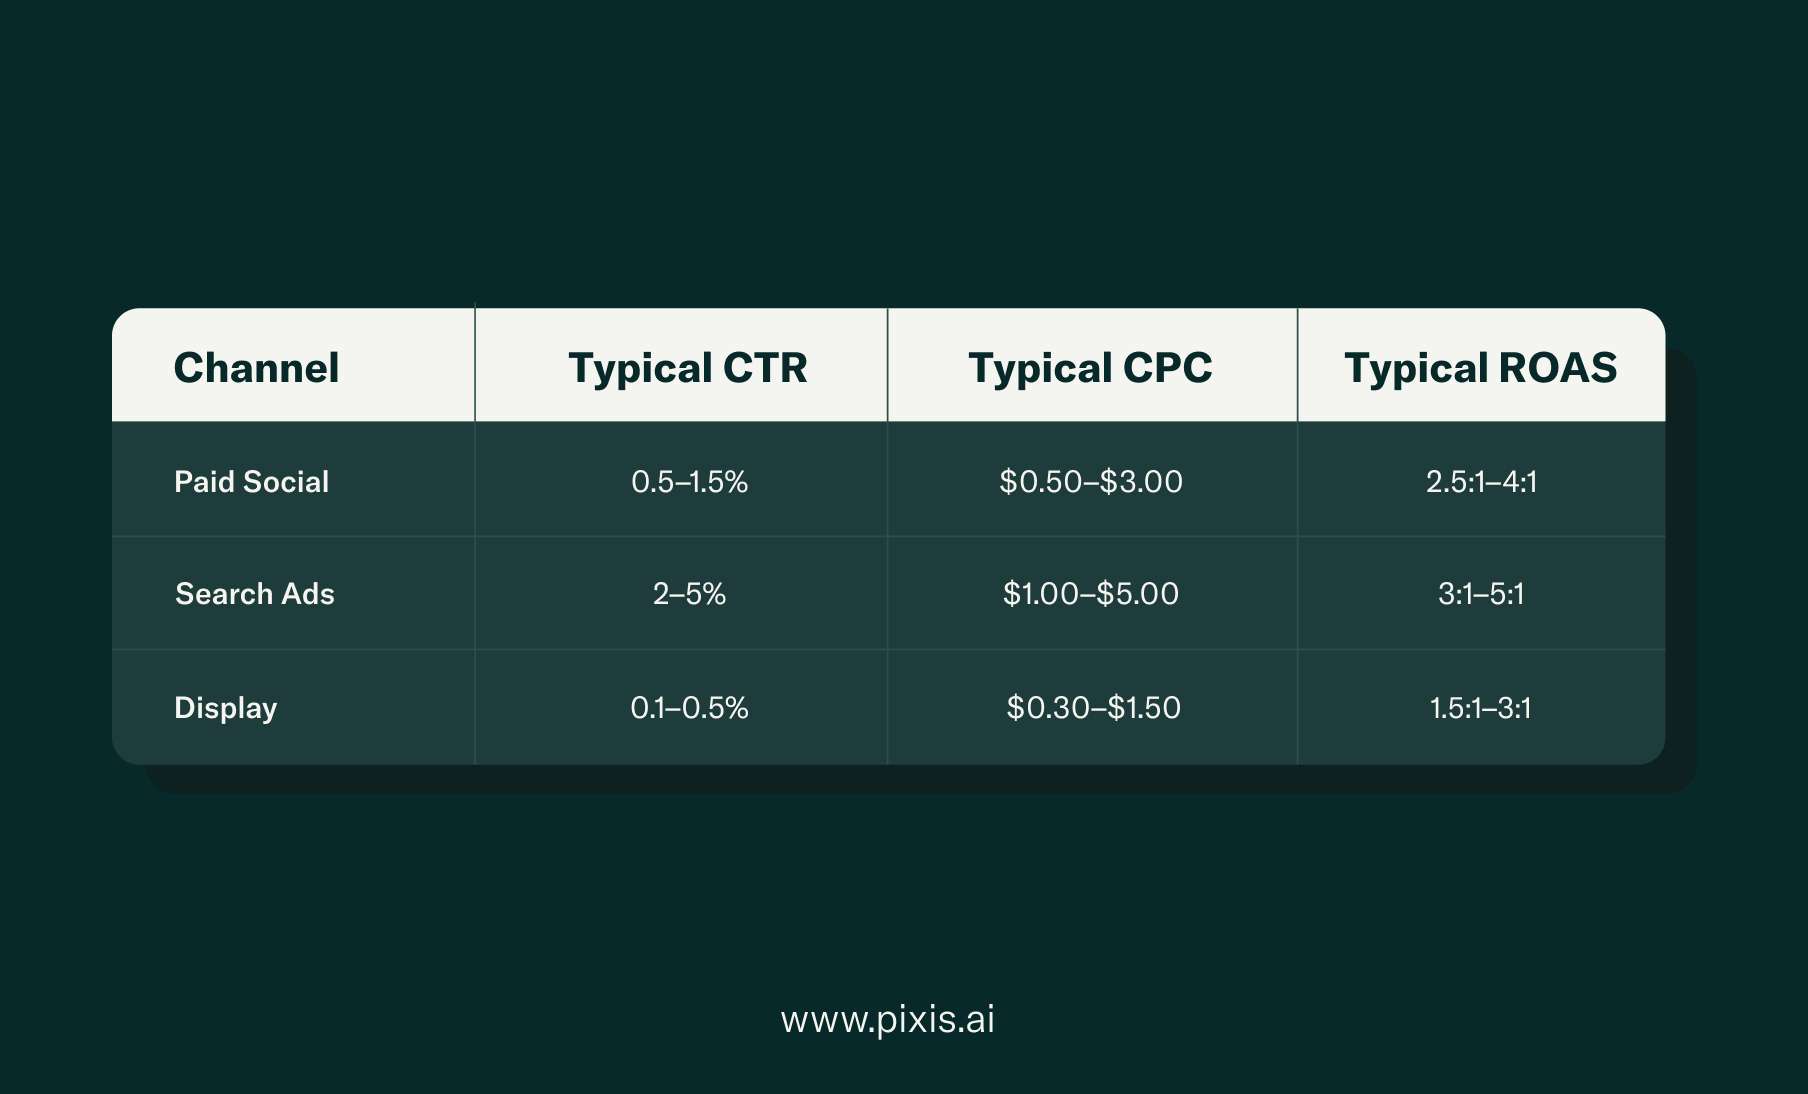
Good CTR varies by channel. Paid search typically sees 2–5%, while display ads average 0.1–0.5%. Social ads fall somewhere in between at 0.5–1.5%.
Use CTR to gauge whether your ad resonates. A sudden drop signals ad fatigue or audience mismatch.
2. Cost per click formula
CPC equals total spend divided by total clicks. If you spend $500 and get 250 clicks, your CPC is $2.
Lower CPCs let you drive more traffic with the same budget. But don't optimize for CPC alone—cheap clicks that don't convert waste just as much money as expensive ones.
3. Cost per acquisition formula
CPA equals total spend divided by conversions. If you spend $1,000 and get 25 purchases, your CPA is $40.
Your target CPA depends on profit margins. For example, if you make $60 profit per sale, a $40 CPA leaves you with $20 in net profit. A $70 CPA means you're losing $10 per sale.
4. Return on ad spend formula
ROAS equals revenue divided by ad spend. If you spend $1,000 and generate $4,000 in revenue, your ROAS is 4:1 or 400%.
ROAS measures profitability at the campaign level. It tells you which campaigns deserve more budget and which ones to pause. Unlike CPA, ROAS accounts for revenue—so it captures differences in order value.
5. Customer lifetime value formula
A simple LTV calculation multiplies average order value by purchase frequency by average customer lifespan. If customers spend $50 per order, buy four times per year, and stay for three years, their LTV is $600.
LTV determines how aggressively you can acquire customers. Higher LTV means you can afford higher CPAs and still stay profitable.
Choosing the right metrics for your campaign objectives
Not all metrics matter equally for every campaign. Your goals determine which numbers to watch and which to ignore.
Optimizing for the wrong metric wastes time and budget. Running a brand awareness campaign? Obsessing over CPA doesn't make sense. Driving direct sales? Impressions alone won't tell you much.
Brand awareness goals
Focus on reach, impressions, and brand lift when visibility is your goal. Brand lift studies measure changes in brand recall, consideration, and favorability after exposure to your ads.
Awareness campaigns prioritize getting in front of new audiences. You're not expecting immediate conversions—you're planting seeds. CPM becomes your efficiency metric here, not CPA.
Direct response goals
Prioritize conversion rate, CPA, and ROAS when you want immediate sales or sign-ups. Direct response campaigns live or die by efficiency. Every dollar spent gets evaluated against revenue generated.
Watch frequency closely in direct response campaigns. High frequency without conversions signals creative fatigue or audience saturation.
Full-funnel goals
Combine awareness and conversion metrics when you're targeting multiple journey stages. Track impressions and reach at the top, CTR and engagement in the middle, conversions at the bottom.
Full-funnel campaigns require patience. Top-of-funnel exposure doesn't convert immediately, but it supports bottom-funnel performance. You might see impressions spike weeks before conversions follow.
Benchmarks that signal healthy performance and when to pivot
Benchmarks vary by industry, channel, and campaign type. But general ranges help you spot when performance drifts off track.
Use benchmarks as guardrails, not targets. Your specific numbers depend on product price, audience maturity, and competitive intensity.
Paid social benchmarks
Facebook and Instagram ads typically see CTRs between 0.5% and 1.5%. CPCs range from $0.50 to $3.00 depending on audience competitiveness.
LinkedIn ads cost more—CPCs often hit $5–$10—but reach professional audiences with higher purchase power. Expect lower CTRs (0.3–0.8%) but higher-quality leads.
If your paid social CTR drops below 0.3%, your creative likely needs refreshing or your targeting is too broad.
Search benchmarks
Google Ads CTRs for search campaigns typically range from 2% to 5%. Brand terms perform higher (often 10%+), while generic keywords fall lower.
Quality Score matters here. Low scores (below 5/10) inflate your CPCs and hurt ad position. Improve relevance between keywords, ad copy, and landing pages to boost Quality Score.
Display and video benchmarks
Display ad CTRs average 0.1–0.5%. Video ads perform slightly better at 0.5–1.0%.
Video completion rate measures how many people watched your entire video ad. A VCR above 25% is solid for skippable ads. Above 70% for non-skippable ads.
From insight to action with AI-powered optimization
Tracking metrics is only half the job. Acting on them quickly separates high-performing campaigns from mediocre ones.
Manual optimization takes time. You spot an underperforming ad set, decide to shift budget, log into the platform, adjust bids, and monitor results. By the time you react, you've already wasted budget.
Real-time budget shifts
AI moves budget toward better-performing campaigns within minutes, not days. If one ad set hits a 5:1 ROAS while another sits at 2:1, the system reallocates spend automatically.
This happens continuously, not just when you check your dashboard. Budget flows to what's working right now, not what worked yesterday.
We at Pixis built our platform to make budget shifts seamless across channels. The AI watches your ROAS, CPA, and conversion metrics, then adjusts bids and budgets to keep performance on target.
Creative variant testing
AI tests different ad creative based on engagement and conversion data. It identifies which headlines, images, and calls-to-action drive results, then allocates more impressions to winners.
Traditional A/B testing takes weeks. AI-powered testing happens in real time, cycling through variations and learning from each impression. You get answers faster and waste less budget on underperforming creative.
Audience refinement
AI uses conversion data to find similar high-value audiences automatically. It identifies patterns in who converts, then expands targeting to reach more people like them.
Manual audience building relies on assumptions. AI audience building relies on actual behavior. The system spots signals you might miss—like specific device types, browsing times, or content affinities that correlate with conversions.
Start optimizing with Pixis today
Common mistakes that skew your numbers and how to fix them
Even accurate tracking can mislead you if you're not watching for common pitfalls. Small errors compound quickly.
A broken tracking pixel might undercount conversions by 20%, making profitable campaigns look unprofitable. You pause them, lose revenue, and never realize the data was wrong.
- Tracking pixel gaps: Missing or broken pixels create attribution problems. Test your pixels regularly by completing a test conversion and verifying it appears in your dashboard.
- Channel attribution overlap: Multiple channels can claim credit for the same conversion. Someone sees a Facebook ad, clicks a Google ad, then converts. Both platforms report the conversion, inflating your totals.
- Data freshness lags: Delayed data leads to poor optimization decisions. If your dashboard shows yesterday's numbers, you're reacting to old information. Most platforms offer real-time reporting—turn it on.
- Ignoring assisted conversions: Last-click attribution credits only the final touchpoint before conversion. But awareness campaigns at the top of the funnel contribute too, even if they don't get credit.
Your next move: grow faster with Pixis
You now understand which metrics matter and how to calculate them. The next step is acting on insights faster than your competition.
Manual optimization keeps you reactive. You spot problems after they've already cost money. You miss opportunities because you're not monitoring performance 24/7.
We built an AI-powered advertising platform that turns metric insights into automatic optimizations. Our system monitors your ROAS, CPA, CTR, and conversion metrics in real time, then adjusts bids, budgets, and targeting to keep performance on track.
The platform handles audience targeting, creative testing, and budget allocation automatically. It learns from every impression and conversion, continuously improving your results. You focus on strategy and creative direction while the AI handles execution.
Try Pixis free and see your metrics improve
FAQs about advertising performance metrics
How often should you check advertising metrics?
Check active campaigns daily to catch issues before they waste significant budget. Weekly reviews work better for strategic analysis—daily fluctuations smooth out over seven days, giving you clearer trends.
Real-time monitoring prevents the most expensive mistakes. If a campaign's CPA suddenly doubles, you want to know within hours, not days.
Which advertising metrics matter most for small budgets?
Focus on cost per acquisition and return on ad spend first. These connect spending directly to revenue, helping you stretch limited budgets.
Small budgets can't afford vanity metrics. Every dollar counts, so prioritize metrics that measure actual business outcomes over awareness metrics like impressions.
How do iOS privacy changes affect advertising metrics?
Attribution windows shortened and conversion tracking became less precise after iOS 14.5. Many conversions that used to get tracked now go unattributed.
Use first-party data and broader conversion windows to maintain accuracy. Aggregate reporting replaces individual-level tracking, so expect less granular audience insights.