
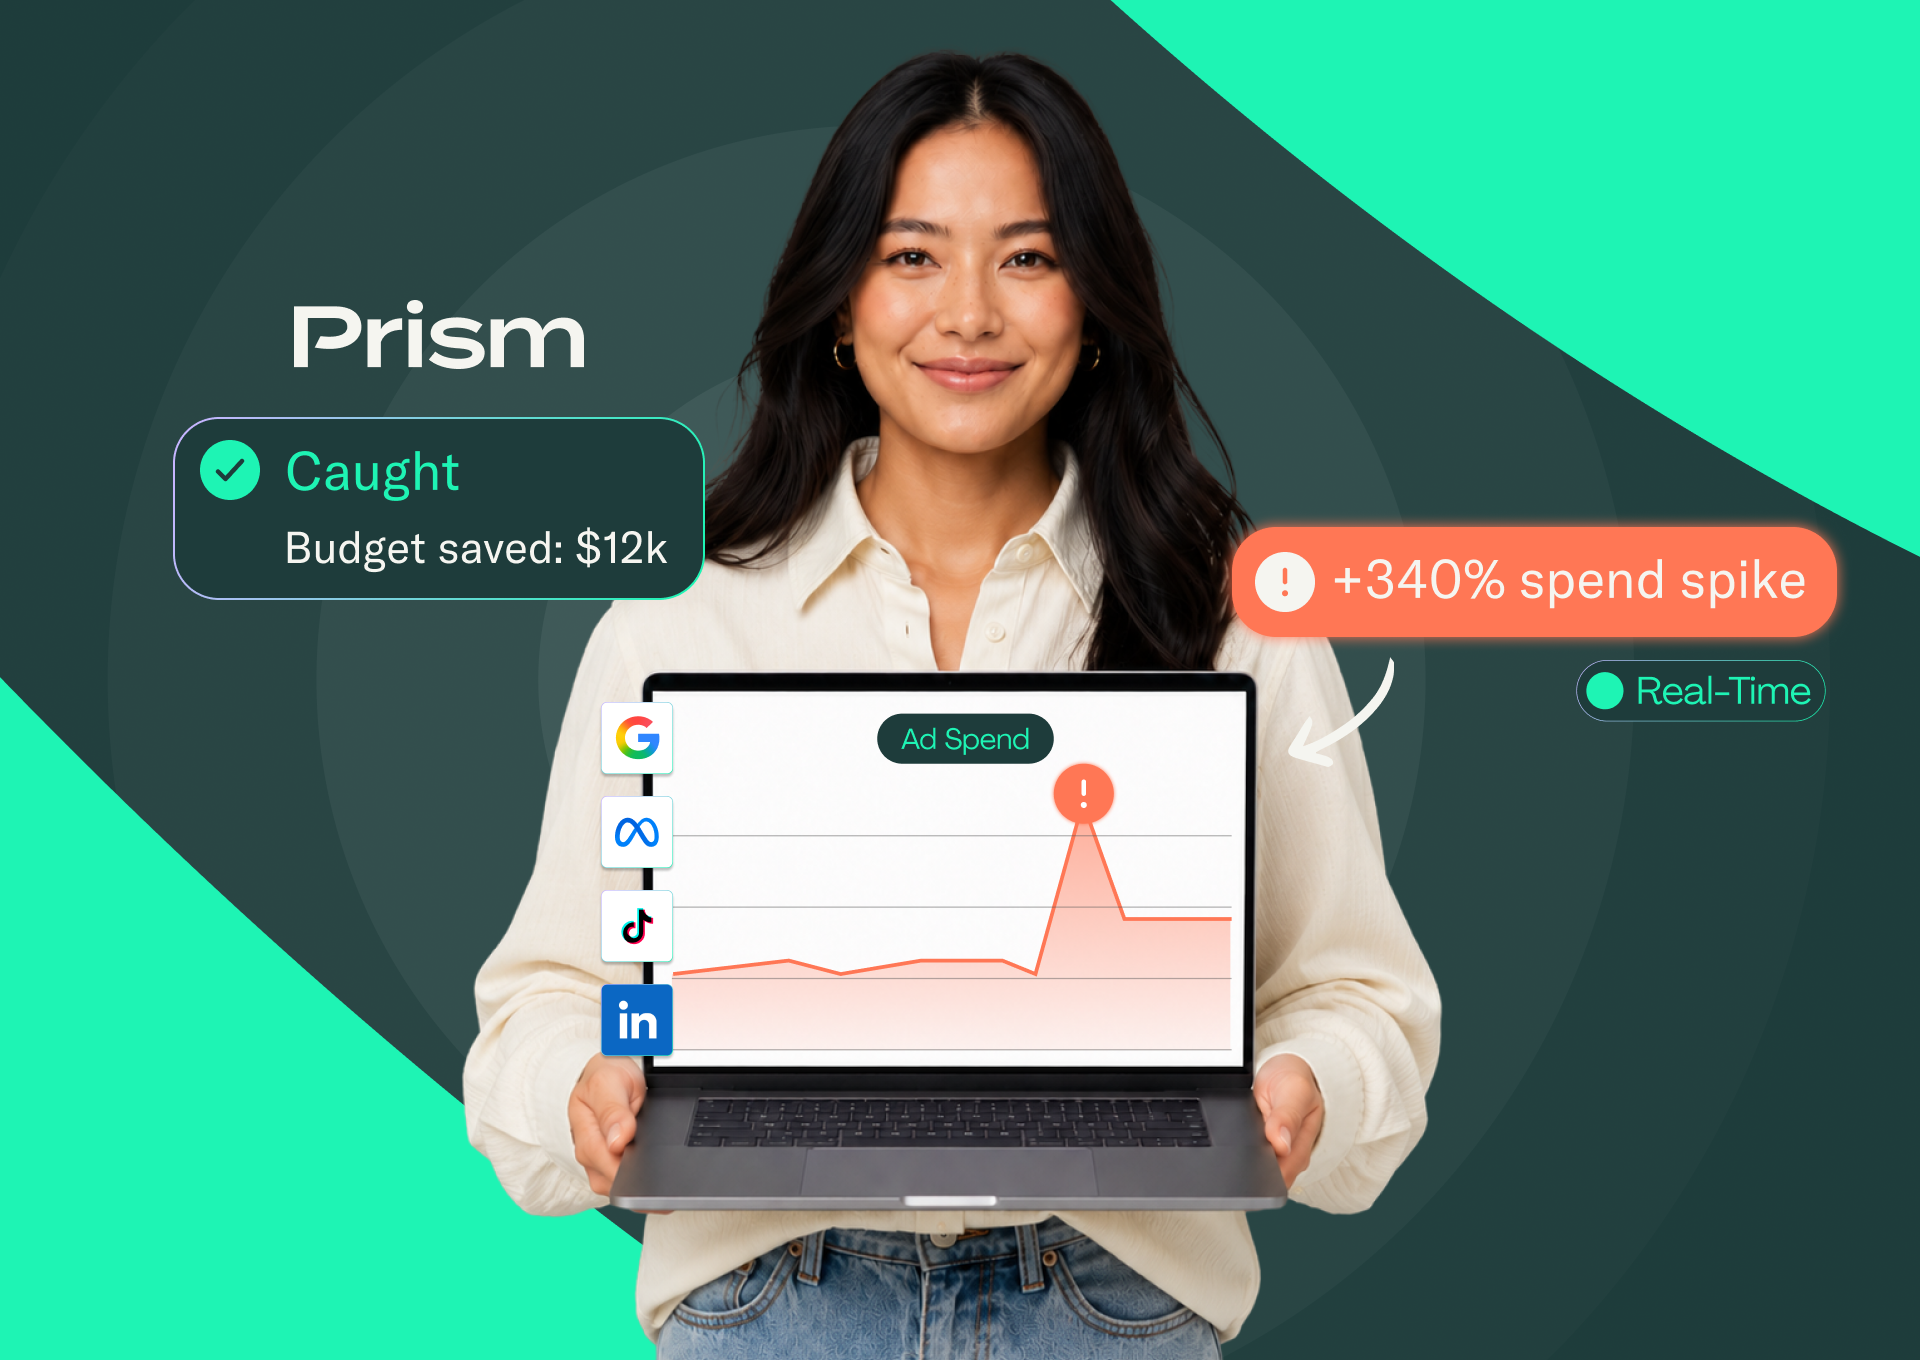
A campaign that overspends by 15% across a week is an annoyance you fix on Monday. A campaign that consumes a month of budget between midnight and nine in the morning is a different category of problem, and the uncomfortable part is that both begin identically: a small deviation nobody was watching. Automated bidding makes thousands of allocation decisions per hour, compressing the distance between a configuration error and a material loss into a window measured in hours. This guide covers what genuinely counts as an anomaly and what is ordinary variance, how the detection methods work and where each one fails, how to set thresholds that survive contact with a real account, and what to do in the sixty minutes after an alert fires.
Ad-spend anomalies compound quickly because automated bidding acts continuously, so the practical detection window is hours rather than days. This covers the anomaly taxonomy, the statistical methods behind detection, threshold design, and a triage sequence for the first hour.
Key Takeaways
- Detection has to run against a learned baseline rather than a fixed threshold, because static rules break the moment budgets scale or seasonality shifts.
- Anomalies are diagnosed by combining metrics, not by single metrics. Spending rising while conversions flatten means something different from CPA climbing while ROAS falls.
- The second-order cost is often larger than the wasted spend, since bidding algorithms train on corrupted data and propagate the error.
- Alert thresholds need tuning for precision, because a team that has learned to dismiss notifications will dismiss the important ones.
- A fixed triage sequence, verify, then diagnose, then mitigate, then document, prevents both panic-pausing healthy campaigns and investigating too slowly to matter.
Why the Detection Window Is Measured in Hours
Automated bidding does not observe your working hours. It reallocates continuously based on whatever signal it receives, which makes it effective and also allows an unattended error to compound. A tracking pixel that breaks at 11 pm means the system spends the entire night optimizing against a signal that no longer describes reality. By the time anyone opens a dashboard, the cost has two components: the spend that produced nothing, and the learning the algorithm absorbed while the data was wrong.
Manual monitoring cannot close that gap, and the reason is structural rather than a matter of diligence. Checking dashboards each morning creates a detection window roughly the length of a working day, whereas systems that operate continuously have no such window. Adding a second daily check halves exposure without changing the problem's shape. Teams that have been through a serious incident usually arrive at the same conclusion: the monitoring has to run on the same clock as the spending.
Scale changes the arithmetic further. On a $5,000 monthly budget, a runaway caught in twelve hours is a recoverable mistake. On $500,000 across four platforms, the same twelve hours is a material number, and the probability of an unnoticed failure rises with the number of campaigns, platforms, and automated rules interacting with each other.
The Anomaly Taxonomy
An anomaly is a statistically meaningful deviation from expected behavior, which is narrower than it sounds. A Tuesday five percent below forecast is an auction variance. A Tuesday where CPA triples while conversions reach zero is a systems failure. Treating both as alerts produces fatigue, and fatigue is how real incidents get missed.
The patterns worth building detection around, and what each one usually means:
Spend spikes above baseline with no corresponding change. No new creative, no bid adjustment, no budget edit, yet consumption jumps sharply. This is the classic runaway, and the cause is usually either an automated rule interacting badly with another rule, a campaign exiting the learning phase and unlocking delivery, or a manual edit someone forgot to mention. Typical detection window if monitored: under an hour. If unmonitored, whenever someone next looks.
Unexpected underspend. Delivery has stalled, an account or asset has been restricted, or a learning phase has reset. The cost is measured in impression share rather than cash, which makes it easy to miss entirely, and it frequently goes undetected for days because no alarm is set when money isn't spent. Underspend also compounds differently: the budget you failed to deploy during a high-intent period cannot be recovered by spending double later.
Efficiency collapse. ROAS or CPA moving sharply against you, most often because delivery has shifted toward low-intent placements or broad audience segments. The signature is spent holding steady while output degrades, which distinguishes it from a runaway.
CPC inflation beyond market movement. Either your bidding strategy has drifted from its constraints, or genuine new auction pressure has appeared. These need opposite responses, so the diagnostic question is whether competitors' behavior changed or yours did.
Tracking outages. Conversions flatten while clicks and spend continue at normal levels. You are still buying traffic, but you have simply lost the ability to see what it does. This is the most dangerous category because the account looks healthy on spend metrics, while the optimization signal is corrupt.
Conversion infrastructure failures. Server-side event failures, tag misfires, or a checkout flow that failed to complete. Similar signature to a tracking outage, different fix, and worth separating because the remediation path runs through engineering rather than the ad platform.
Slow bleed. No dramatic spike, just a gradual drift, a few percent efficiency loss per week that never crosses a threshold but consumes a meaningful share of a quarter. Threshold-based alerting is structurally blind to this, which is why moving-average detection matters.
The second-order cost deserves emphasis. When bidding algorithms train on corrupted data, they learn the wrong lesson and push further in that direction, so a tracking outage caught three days late has degraded optimization well beyond the spend it wasted. Recovery then requires a relearning period on top of the direct loss.
How the Detection Methods Actually Work
Reliable detection compares live data against a learned baseline rather than a fixed limit. Static thresholds fail predictably in both directions: an alert set at a fixed daily spend fires constantly through peak season and stays silent through a genuine problem in a quiet month. A rolling baseline adapts to recent behavior and absorbs day-of-week patterns, so a Black Friday spike reads as expected scaling rather than an emergency.
The statistical approaches layer rather than compete, and each has a specific blind spot worth knowing.
Z-score detection measures how many standard deviations a value sits from the historical mean. A campaign averaging $1,000 daily spend with a $150 standard deviation would flag at roughly $1,450 on a three-sigma rule, a common convention because approximately 99.7% of observations in a normal distribution fall within three standard deviations, making anything beyond it statistically rare. It is objective and easy to reason about. Its weakness is the normality assumption, since paid media metrics are often not normally distributed, and accounts with a few extreme historical days will have an inflated standard deviation that quietly swallows real anomalies.
Interquartile-range thresholds flag values beyond 1.5 times the spread between the 25th and 75th percentiles. The 1.5 multiplier is not arbitrary: Tukey selected it so that in a normal distribution roughly 0.7% of observations fall outside the fences, which is sensitive enough to catch real outliers without flagging routine variance. Because it works from percentiles rather than the mean, it resists distortion from past extreme days, which makes it the better choice for accounts with volatile histories where a Z-score would be swallowed by an inflated standard deviation. The NIST Engineering Statistics Handbook covers the underlying tests in detail. The tradeoff is reduced sensitivity to moderate deviations.
Moving-average baselines smooth short-term variance, revealing gradual drift. This is the method that catches slow bleed; the pattern with no threshold rule will never surface. Catching that early is the same discipline as preventing ROAS drift before it reaches the weekly report, where pacing becomes a daily decision rather than a monthly explanation. The tradeoff is lag: a moving average reacts slowly by design, so it should never be your only detection layer.
Time-series decomposition separates a metric into trend, seasonality, and residual components, which enable a system to distinguish a promotional lift from a malfunction. It handles multiple overlapping seasonalities and weekly patterns nested within annual ones better than any simpler method. It also requires meaningful history to work, so it is weakest on new accounts and new campaigns, exactly where anomalies are most common.
Machine learning approaches extend all of this by learning relationships across metrics rather than watching each one in isolation. The genuinely useful signal is often correlational: a slight CTR decline paired with a conversion shift and a change in placement mix. That is the pattern a person scanning a dashboard will miss, and a model watching the full set will catch. The practical constraint is that these models need enough history to distinguish normal from anomalous, and they are opaque enough that teams should expect to see the reasoning, not just the alert.
Layering matters more than picking a winner. A workable stack runs fast statistical checks for sharp deviations, moving averages for drift, and correlation-based detection of multi-metric patterns, with each layer covering another's blind spot.
Designing Thresholds That Hold Up
Threshold design is where most detection programs quietly fail, and the failure is almost always the same: alerts tuned so sensitively that the team stops reading them.
Start by separating severity tiers rather than treating every deviation identically. A useful structure runs three levels. Critical covers deviations severe enough to justify waking someone, typically spending or efficiency breaking far outside baseline with high statistical confidence. Warning covers deviations worth investigating within the working day. Informational covers patterns worth noting in a weekly review, but not acting on immediately. Routing differs by tier, and conflating them is what produces fatigue.
Set thresholds against your own account history rather than published benchmarks, since a CPA that would be alarming in one vertical is unremarkable in another. Tune for precision first, then sensitivity: begin conservatively so early alerts are almost all real, then tighten as the team builds trust in the system. The reverse order produces a team that ignores the channel within two weeks.
Account for known events explicitly. Promotional periods, product launches, and seasonal peaks should suppress or adjust thresholds rather than generating alerts everyone knows are false. And review threshold performance periodically, tracking how many alerts led to action, because an alert stream where nothing requires action is a stream that will be ignored when it matters.
What to Look For in Monitoring Capability
Native platform rules are a reasonable floor. They are also reactive, bound to their own platform, and blind to everything happening elsewhere in your mix, which is a real limitation when spend spans several networks and a failure in one appears as a distortion in another.
What matters more than any individual feature is how the pieces work together. Continuous data ingestion only helps if it feeds a baseline that understands your account. Alerting only helps if it provides enough context to triage, including the campaign, the platform, the specific metric that deviated, the magnitude, and, ideally, the likely cause. Automated action is only safe when the confidence behind it is high enough to avoid pausing profitable campaigns on a false positive.
Root cause analysis is the capability teams most consistently underestimate. An alert reporting that spending tripled is far less useful than one also showing that a budget was edited at 2 am, by whom, and from what value to what value. The difference determines whether the diagnosis takes two minutes or forty.
Cross-channel coverage is the other structural requirement. A unified view is what lets you see that a spend spike on one platform coincided with a tracking break affecting all of them, which is a different diagnosis and a different fix than a platform-specific bidding problem.
How Prism Fits This Work
Prism approaches this as an agentic system rather than an alerting layer, which changes what happens after detection. The six agents cover Meta, Google with SEMrush, and TikTok, alongside creative agents for Meta and Google, and a competitor ads agent, so the monitoring surface spans the channels where spend actually sits rather than focusing on one platform at a time. The system is built on Model Context Protocol and trained on a large body of performance data, and the interface is conversational, so a diagnostic question can be asked in plain language rather than assembled through filters.
Three capabilities carry most of the weight here, and they matter primarily in combination. Scheduled Workflows run recurring checks on whatever cadence you set, so diagnosis happens on a schedule rather than whenever someone remembers to look, and each run produces a structured result rather than a bare notification. Brand Knowledge provides account context, which allows a deviation to be assessed against how your account actually behaves rather than a generic threshold. Campaign Portfolio provides the cross-account view, so a problem is visible against everything else running rather than in isolation. Detection without context produces noise; context without scheduling produces gaps.
On execution, Prism acts rather than only reporting. It connects across Meta, Google, and TikTok and can adjust bids, reallocate budgets, and carry a diagnosis through to a change in the account. One boundary is deliberate and worth stating plainly: creative generation sits outside Prism's action layer. Prism identifies creative fatigue and recommends a refresh, and production runs through AdRoom, which keeps brand and compliance decisions with your team. That split follows a consistent principle: automating decisions where errors are recoverable while keeping humans on those that carry brand risk. Prism holds SOC 2 Type II, which matters to whoever has to approve granting any system write access to live ad accounts.
The Metrics That Surface Problems Earliest
Spend velocity tells you where money is going right now and is the fastest indicator of a runaway. On its own, it lacks context, which is why it needs to be paired with efficiency signals rather than being watched alone.
CPC and CPA track unit economics and reveal whether auction conditions have moved against you. ROAS confirms whether spend is producing business results rather than activity. CTR and impression volume surface traffic quality problems, creative fatigue, and share-of-voice shifts, and they often move before the conversion metrics do, which makes them useful as leading indicators. Total conversions validate that tracking is intact, which is why a sudden flatline there is diagnostic in a way a gradual decline is not.
Cross-checking platform-reported conversions against your own analytics gives you an independent read when a network's self-reported numbers look better than the revenue suggests. That discrepancy, platform conversions up while on-site engagement stays flat, is one of the more reliable early signals that something upstream has broken.
Reading these in combination is the actual skill. A few signatures worth memorizing:
- Spend up, conversions flat, clicks normal: tracking failure.
- Spend up, conversions up proportionally, CPA stable: successful scaling, not an anomaly. Worth confirming against your scaling routine before anyone intervenes and unnecessarily resets a learning phase.
- Spend flat, CPA up, CTR down, ROAS down: genuine performance decay, often creative fatigue.
- Spend down, impressions down, no account changes: delivery or restriction problem.
- CPC up, impression share down, spend flat: new auction pressure from a competitor.
Same alert severity in several of these cases, entirely different problems, entirely different fixes.
The First Hour After an Alert
A fixed sequence prevents the two common failure modes: panic-pausing a campaign that was performing fine, and investigating so slowly that the spend continues throughout the investigation.
Verify, roughly the first five minutes. Confirm the data is real before acting. Reporting delays and attribution lags produce alarming numbers that resolve on their own, and a pause executed against a reporting artifact is a self-inflicted loss. Check whether the anomaly appears in the platform interface and in your monitoring layer.
Diagnose, the next fifteen. Check the change history first, because a surprising share of anomalies trace to a manual edit or an automated rule firing as designed. Then delivery settings, then audience and placement mix, then auction conditions. Working in that order matters: the cheapest explanations are the most common ones, and starting with auction dynamics wastes time on the least likely cause.
Mitigate, immediately once diagnosed. Pause the affected ad sets or adjust bids to stop the loss. Contain before you optimize. The instinct to fix the underlying problem first is understandable and usually expensive, because diagnosis of a root cause can take hours while the spend continues.
Document, same day. Record what happened, the signature it presented, the root cause, and the fix. This is what improves the baseline and prevents the same incident being diagnosed from scratch next quarter by someone who was not there. Teams that skip this step re-solve the same problems repeatedly.
Alert context governs how fast this runs. An alert naming the campaign, platform, deviating metric, magnitude, and severity lets a team triage in minutes. An alert saying something looks wrong sends them hunting, and the hunt is where the budget goes.
Where Detection Programs Go Wrong
A few failure modes recur often enough to name.
Alerting on everything, which trains the team to ignore the channel. The fix is severity tiering and ruthless tuning for precision.
Monitoring platforms in isolation, so cross-channel patterns stay invisible and the same incident gets diagnosed three times by three people looking at three dashboards.
Setting thresholds once and never revisiting them, so they drift out of relevance as budgets scale and the account changes shape.
Automating actions before the alerting logic has earned trust has led to paused, profitable campaigns and a team that turns the automation off.
Treating detection as a tooling purchase rather than an operational practice. The tool surfaces the anomaly; the runbook, the severity tiers, and the documented incident history are what turn a surfaced anomaly into a contained one.
What Proactive Detection Buys You
The direct return is reduced waste, which is easy to quantify once the first incident is caught early. The larger return is what makes it possible: teams that trust their monitoring scale budgets faster, test more, and expand into new channels sooner, because the downside of an unnoticed failure has been bounded.
There is also a quieter benefit in protecting algorithmic learning. Catching a tracking break within an hour rather than three days means the bidding models never absorbed the corrupted signal, so performance resumes immediately instead of requiring a relearning period that costs more than the original incident.
And there is an organizational effect worth naming. Teams operating without reliable detection tend to manage risk by staying small, keeping budgets conservative, and testing less because the cost of an unnoticed failure is unbounded. Bounding that cost changes what the team is willing to attempt.