
The second GEO audit is back, and the headline number is up. Citation rate rose four points, share of voice is higher on two engines, and someone wants to put it in the monthly report as proof the content work paid off.
Before you do, ask a simpler question: would the number have moved anyway? AI answers change from run to run. Engines update their models, competitors publish, and a prompt set that drifted between audits can produce a gain on its own.
A useful comparison holds the inputs still, measures how much the numbers move with no intervention, and only then reads the difference between audit A and audit B. The discipline takes a little planning, but it is what turns a delta into evidence.
This guide covers how to freeze the setup, measure the noise, compare the right metrics, isolate your effect, and report the result, including when the honest answer is "no change yet".
Key takeaways
- Keep every input identical between audits: the same prompts, engines, language, location, competitors and metric definitions.
- Run the baseline more than once to measure normal run-to-run movement; a delta inside that band is noise, not a result.
- Call a change real only when it lands outside the band on two consecutive audits.
- Use a holdout group of prompts your change should not affect, and subtract its movement from the treatment group's.
- Do not confuse a product's GEO score with the 0 to 1 score from the GEO-16 research; they measure different things on different scales.
- Pixis Visibility can schedule GEO audits and compare them over time; deciding what counts as a real change stays with your team.
1. Freeze the setup before the second audit
The baseline audit is the reference for every delta you will report, so record its parameters before anything else changes:
- Prompt set: the exact prompts, saved with a date.
- Engines: for example ChatGPT, Perplexity, Gemini and Claude.
- Language and location used for each run.
- Competitor list and any personas.
- Metric definitions, including the denominator for each one.
If you need new prompts, start them as a separate series with their own baseline. Adding them to the original set means audit B covers different questions from audit A, and no adjustment makes those two samples comparable.
Write down your decision rule at the same time: what size of change, on which metric, over how many audits, will you treat as real? Deciding this before you see the numbers keeps the reading honest. If you have not run a first audit yet, start with how to audit your AI search visibility in 15 minutes.
2. Measure the noise in a baseline week
AI answers are not deterministic. The same prompt can produce a different answer, cite different sources or list brands in a different order on the next run.
Run the full audit several times in your baseline week, ideally three, without changing anything. For each metric on each engine, note the lowest and highest values. That range is your variance band.
The band tells you what "no change" looks like. If citation rate on one engine swings by six points between runs with no intervention, a five-point gain after your change is not a result, however good it looks in a chart.
3. Compare the same metrics with the same denominators
Pick a short list of metrics and define each one precisely:
- Citation rate: answers that cite your domain, divided by all collected answers.
- Brand mention rate: answers that mention your brand, divided by all collected answers.
- Share of voice: your mentions as a share of all tracked brand mentions, ideally split by funnel stage (TOFU, MOFU and BOFU).
- Average position: where your brand appears in answers that mention it.
- Per-engine results: each metric for each engine separately, not only the blended figure.
Share of voice is relative to the competitors you track, so report the competitor roster with every figure. Different tools compute these metrics over different prompts and engines, so compare audits from the same tool only.
Two different "GEO scores"
The term GEO score is used in two different ways, and mixing them up makes a comparison meaningless.
Platform GEO scores are composite visibility scores. In Pixis Visibility, the GEO score is reported out of 100 and summarizes how the brand shows up across the audit. For how to read composite scores like this, see what an AI visibility score is and how to interpret it.
The GEO-16 study on arXiv uses a different score, G, on a 0 to 1 scale. It rates the on-page quality of individual pages across 16 pillars, such as metadata, freshness, semantic HTML and structured data. It is a page-quality framework, not a measure of how often a brand appears in answers.
Compare platform scores with platform scores. If you also score your pages with the GEO-16 framework, report that as a separate, page-level input.
4. Read each delta against the variance band
Compute each delta as audit B minus audit A, and put it next to the band from your baseline week. Report the denominator, the date window and the number of answers behind every figure, because the same answers divided differently give different numbers that are all correct.
An illustrative comparison, with invented figures:
- Citation rate: audit A 18%, audit B 22%, delta +4 pts, baseline band ±6 pts. Reading: noise.
- Brand mention rate: audit A 31%, audit B 41%, delta +10 pts, baseline band ±5 pts. Reading: possible gain.
- Share of voice, MOFU: audit A 12%, audit B 13%, delta +1 pt, baseline band ±3 pts. Reading: noise.
Only the mention rate moved outside its band, and only once. Treat it as a candidate result. If audit C shows the same movement, you can start calling it real.
5. Isolate your effect with a holdout group
A raw before-and-after number cannot tell your change apart from a model update or a competitor's new page. A holdout group can.
- Split your prompts into a treatment group, which your change should affect, and a holdout group of comparable prompts it should not affect.
- Measure both groups before and after the change.
- Compute (treatment after minus treatment before) minus (holdout after minus holdout before).
This is a difference-in-differences comparison. The subtraction removes movement that hit both groups, such as model updates, seasonal drift or a competitor's launch.
It also changes how you read flat results. If the holdout group fell and the treatment group held steady, your change may have protected visibility in a declining market. Report both trajectories, not only the treatment delta.
For a fuller treatment of attribution, see causal pathways in SEO and GEO.
6. Tie each change to the work you shipped
Write the plan before the edit goes live. Record the page that changed, a hypothesis that could turn out wrong, the prompts the page should win, the engines, the metric and its denominator, the measurement windows and anything else changing at the same time.
Ship one change at a time, and only to pages that feed the treatment group. Two changes at once make the result uninterpretable. Keep measuring for several weeks after the edit date, since retrieval indexes and model behavior do not update the day you publish.
Technical signals are worth comparing between audits too: robots.txt, sitemaps, schema markup and other AI discovery files. They are leading indicators, because they change before citation rate does. The GEO-16 study reports that metadata and freshness had the strongest association with citation, followed by semantic HTML and structured data.
What a comparison cannot prove
Small prompt sets will not reach conventional statistical significance. Treat results as directional, and let a repeat test confirm any finding.
The GEO-16 study is observational and covers English-language B2B SaaS pages, so treat its thresholds as benchmarks rather than targets for your category. There is also no agreed standard for how long pre- and post-periods should be relative to engine update cycles.
Watch for contamination. Internal links, site-wide template changes or shared navigation can carry a change into the holdout group and shrink the measured effect. State what you could not rule out alongside what you found.
Where Pixis Visibility fits
The repeat work in this process is running the same audit on the same setup, again and again, and lining the results up. Pixis Visibility runs GEO audits across ChatGPT, Perplexity, Gemini and Claude, with a GEO score, share of voice by funnel stage and a maturity stage. Audits can be scheduled, compared over time and exported as PDF or PowerPoint for stakeholders.
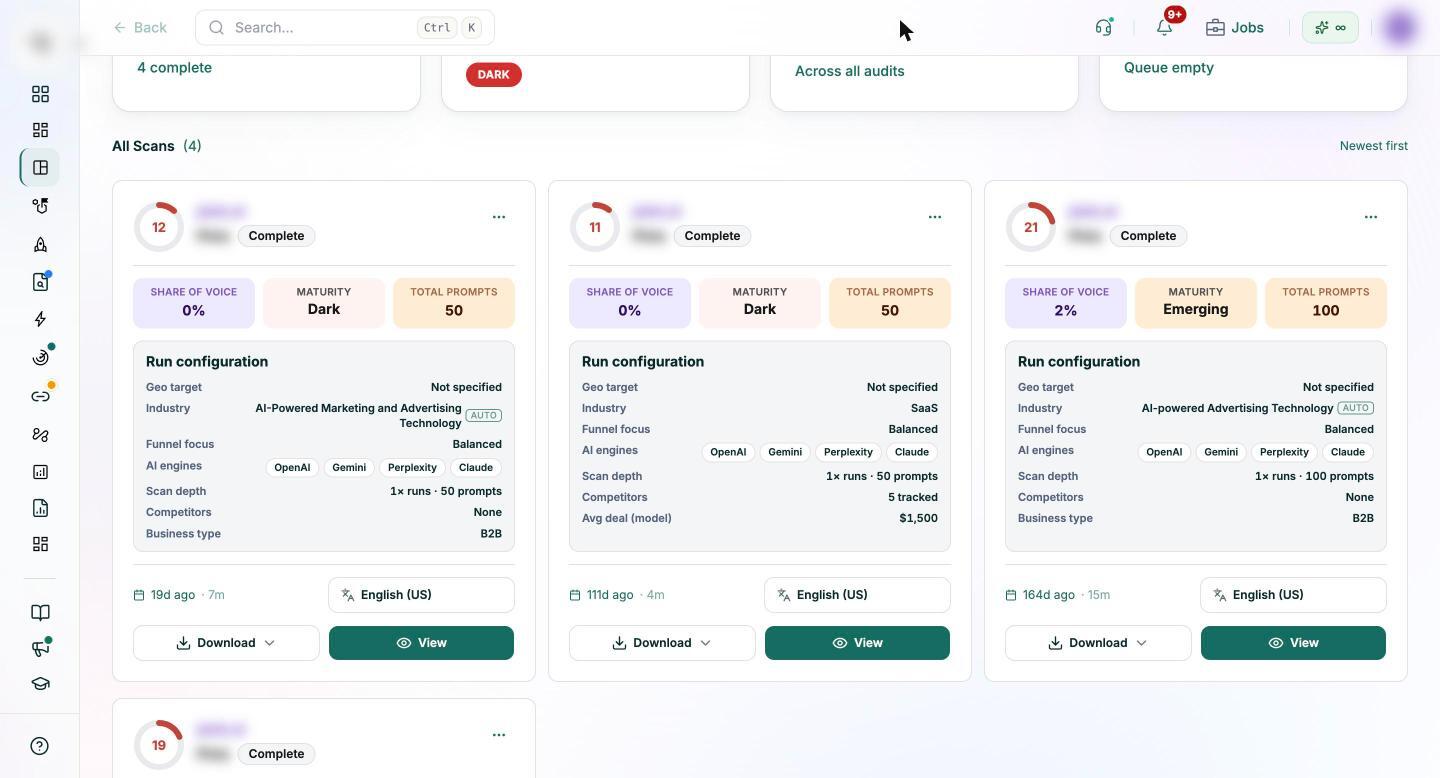
Between audits, prompt tracking records brand mentions, average position, citation rate, share of voice and top-3 presence for each prompt, and shows the actual AI answer, which is how you check whether a delta reflects a real change in what the engines say. The competitor matrix keeps the same roster, up to 20 tracked competitors, across both audits.
What stays with your team is the method: freezing the prompt set, measuring the baseline band, choosing the holdout group and deciding what counts as a result.
Report the result, including no change
Present the comparison as a side-by-side table with the delta and the variance band for each metric, so stakeholders can see at a glance what moved beyond normal noise. Follow it with a short, prioritized list: which prompts to target next, which engines need attention and which pages to change.
When nothing moved outside the band, say so. State the hypothesis, what changed, how you measured it, the size of the difference and what you could not rule out. A clear "no detectable effect yet" protects the credibility of the next result you report.
Get started with Pixis Visibility to schedule GEO audits on a fixed setup and compare the results over time.
FAQs
How often should I re-run a GEO audit?
A full audit every quarter suits most teams for tracking overall progress. To measure a specific change, track the affected prompts weekly or every two weeks, and compare equal-length windows before and after the edit.
Can I compare audits if I changed the prompt list?
Not directly. Different prompts are a different sample. Keep the original set fixed from a known date and start any new prompts as a separate series with its own baseline.
What if I do not have a baseline band?
Treat the first comparison as a new baseline. Run the next audit two or three times without changes to measure the band, then compare against it.
Is a higher GEO-16 page score the same as better AI visibility?
No. The GEO-16 score rates page quality signals, while platform metrics measure how often and how well your brand appears in answers. A better page score is a reason to expect citations to improve, not proof that they did.