
Organic traffic rose 30% last quarter, and leadership wants to know what caused it. The honest answer, for most teams, is that they cannot say, and pretending otherwise is how budgets get misallocated. The content refresh might have driven it. So might a seasonal swing, a competitor's misstep, or an algorithm update that had nothing to do with your work. Distinguishing the action that caused a gain from the coincidence that merely preceded it is the entire problem of attribution, and it gets harder in AI search, where a single answer synthesizes many sources and visibility is even less legible than a ranking. This guide covers the methods that let you attribute gains with defensible confidence, what each one can and cannot prove, and how to build the evidence up from weak to strong.
Two-line summary: Attributing SEO and GEO gains means separating what your action caused from what merely coincided with it, which observational reporting cannot do. This covers incrementality testing, synthetic control, and an evidence ladder for grading how strong your proof actually is.
Key Takeaways
- Correlation is not attribution. Traffic rising after a change is the weakest possible evidence, because seasonality, algorithm updates, and news cycles produce the same pattern without any causal link.
- Causal methods work by building a counterfactual: an estimate of what would have happened without the intervention. The quality of your attribution is the quality of that counterfactual.
- The strength of evidence is a ladder, from observational correlation up to controlled experiments, and honest reporting states which rung a given claim sits on.
- The rigorous methods carry real tradeoffs. Geo experiments and synthetic control give defensible answers but cost time, traffic, or statistical power, and no method delivers certainty.
- GEO attribution is genuinely harder than SEO attribution because the engines are opaque and the metrics are newer, so the discipline is layering imperfect signals, not finding one clean number.
The Core Problem: Correlation Is Not Causation
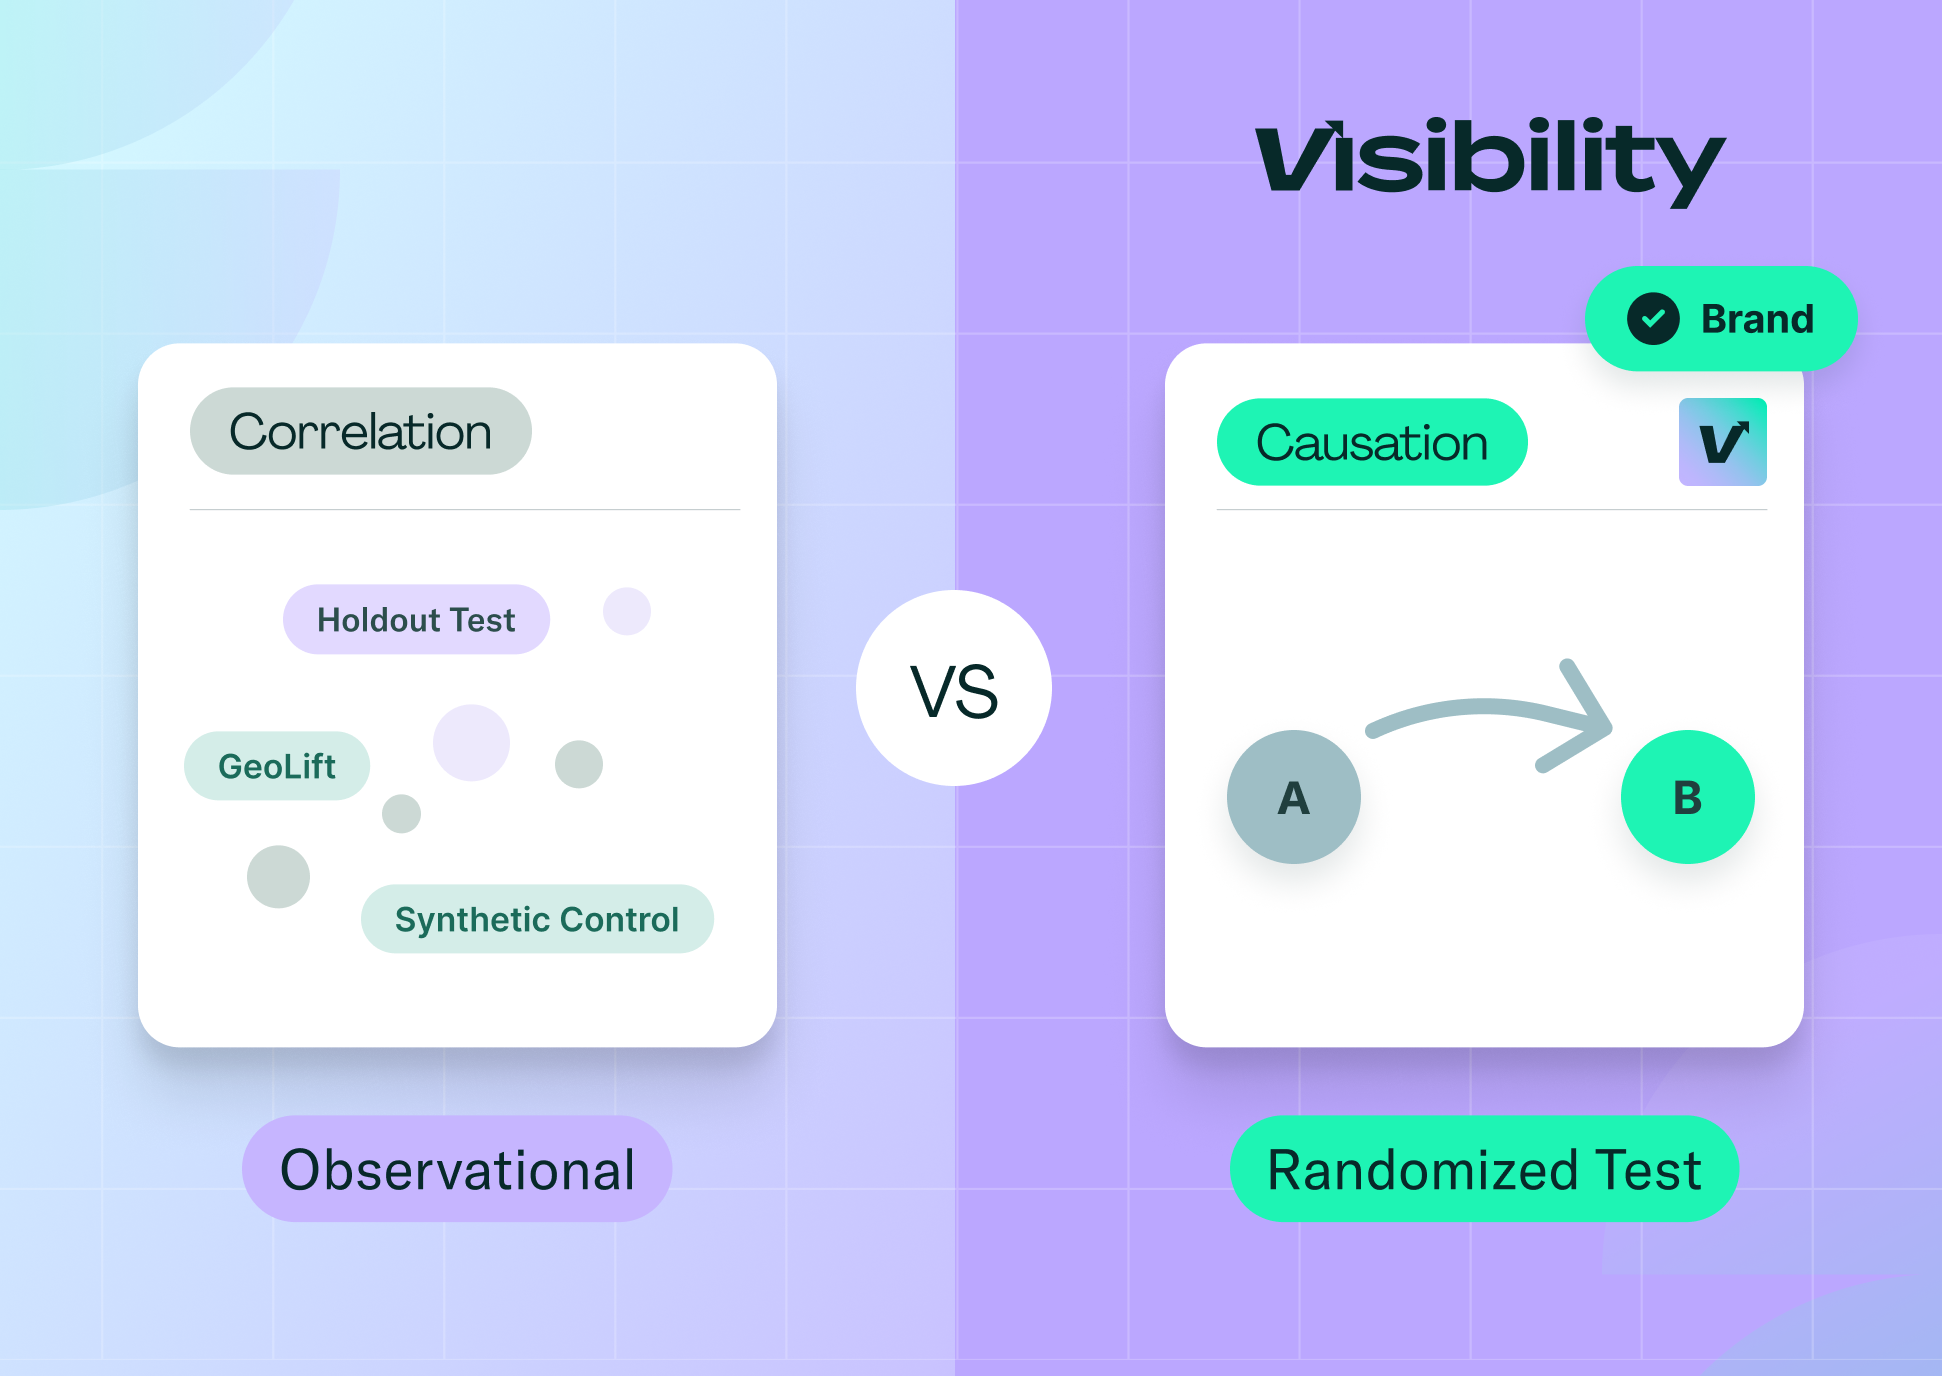
Correlation means two things moved together. Causation means one produced the other. The gap between them is where most attribution goes wrong, because the human instinct is to credit the most recent visible action for any improvement that follows it.
Consider the classic trap. You complete a site architecture overhaul in November, sales spike, and the technical work looks like a triumph. But November is also when holiday shopping starts, so the spike might have happened regardless. Without a way to estimate what sales would have been without the overhaul, you cannot separate the two, and you might pour next year's budget into replicating a technical project that did nothing while the real driver was the calendar. Several forces routinely masquerade as the effect of your work:
- Ranking volatility. Search results shift daily, and algorithms run frequent tests, so a short-lived spike can look like a win when it is noise that reverts within a week. Sustained trends, not single-day jumps, are what carry the signal.
- Site-wide crawl events. A content update can coincide with a broader recrawl that lifts many pages at once, which makes the specific edit look more powerful than it was and can send an editorial team rewriting articles for no return.
- AI model updates. Large language models change their training data and weighting on their own schedule. A brand can appear in AI answers overnight from a backend change unrelated to any campaign, and crediting that to recent work builds a false model of what works.
- Seasonality. Predictable demand cycles can make a strong campaign look weak in a slow month, and a weak one look strong in peak season. A baseline that does not adjust for seasonality produces misleading reads in both directions.
The point of causal attribution is to strip these confounders out, so the number you report reflects your action rather than the environment in which it happened.
The Counterfactual Is the Whole Game
Every causal method, however sophisticated, is doing one thing: estimating the counterfactual, what would have happened without the intervention. You can never observe it directly, because you either made the change or you did not, so the counterfactual is always an estimate, and the credibility of your attribution rests entirely on how good that estimate is.
This reframes the whole exercise. The question is not "did visibility rise after we acted," which is easy and nearly meaningless. It is "did visibility rise more than it would have without us," which is hard and worth answering. Everything below is a different way of constructing that comparison, from a rough eyeball to a controlled experiment, and each buys more confidence at more cost.
Map the Causal Pathway Before Measuring the Lift
Before choosing a method, map the causal pathway that the intervention is expected to affect. In SEO, that pathway may run from a technical or content change to crawling and indexing, ranking visibility, organic visits, conversions, and revenue. In GEO, it is less observable: an intervention may affect retrieval eligibility, source selection, citation, factual use in the answer, brand recommendation, and, eventually, user action. Evidence at one stage does not prove movement at the next. A crawler accessing an updated page does not mean the page influenced an answer, just as a citation does not mean it changed buyer behavior. Generative answers also vary across repeated runs, so attribution should compare changes in the probability or frequency of an outcome across a stable set of prompts, repeated samples, and separate AI engines, rather than relying on individual responses. Defining the expected pathway first prevents teams from using an upstream signal to support a downstream claim that it cannot prove.
The Evidence Ladder: Grade Your Proof Honestly
Not all evidence is equal, and the discipline that separates credible attribution from wishful reporting is naming which rung a given claim sits on rather than presenting all of them as equally solid. A useful ladder runs from weakest to strongest:
- Observational correlation. Traffic rose after a change. This is the floor: it ignores every external factor and proves nothing on its own, though it is fine for generating a hypothesis to test.
- Controlled comparison. Treated pages versus untreated pages. Better, because it introduces a baseline, but vulnerable to selection bias if the two groups differ in ways that also affect the outcome.
- Quasi-experimental design. Synthetic control and similar modeling constructs a statistical counterfactual when true randomization is not possible. This is the workhorse rung for search, where you often cannot randomize.
- Geo experiments and holdouts. Splitting by market to measure incremental lift, which isolates the intervention across regions and supports a genuine causal claim.
- Randomized controlled trials. The strongest design, eliminating most confounders through randomization, and also the hardest to run in a search context.
Higher rungs cost more in data science, time, and complexity, and the honest move is to climb only as high as the decision warrants. A minor content tweak does not need a randomized trial; a company-wide migration strategy probably deserves more than a correlation. The value of the ladder is that it forces you to say, out loud, how confident you actually are entitled to be.
Incrementality Testing With Geo Experiments
Geo experiments are among the most practical ways to get a defensible causal read in search, because they let you run a controlled comparison in the real world without randomizing individual users. The logic is simple: apply the change in some geographic markets, hold others back as a control, and measure the difference.
Meta's GeoLift, an open-source package built on synthetic control methods, is the common tool here. You might roll out a new schema strategy in one set of cities while holding a matched set as control, then measure the visibility difference between them. Done well, this isolates your intervention from the market-wide noise that confounds a simple before-and-after.
The rigor lives in the setup, and the parts teams most often skip are the ones that determine whether the result means anything. Market selection and matching decide whether your control is genuinely comparable to your treatment. A power calculation, run before the test, tells you whether the experiment can even detect an effect of the size you expect, which prevents the common failure of running a test too small to conclude anything. And interpreting the result means reading the confidence interval, not just the point estimate, because an interval that spans zero is not evidence of lift regardless of where its midpoint sits. There is a real tradeoff between speed and rigor here: a faster, smaller test gives a shakier answer, and pretending otherwise is how weak experiments get oversold.
Synthetic Control When You Cannot Split
Some interventions cannot be run as an experiment at all. You cannot migrate half a website, or apply a sitewide technical change to only some pages, so there is no natural control group. Synthetic control fills that gap by building the counterfactual from data instead of a held-back group.
The method constructs a weighted combination of comparable units, similar sites, subfolders, or markets that were not touched, so that their combined pre-intervention behavior closely tracks your own. That composite becomes the prediction of what your site would have done without the change, and the gap between the prediction and your actual results is the estimated causal effect. Google's CausalImpact, an open-source package using Bayesian structural time-series models, is the widely used reference implementation, and it can estimate effects on visibility, traffic, or citations without a live experiment.
One honest caveat keeps this from being oversold. Independent benchmarking of these tools has found they trade off differently between catching real effects and firing on noise: time-series approaches like CausalImpact tend to declare significance more readily, which means more false positives, while synthetic-control geo tools tend to be conservative and miss smaller real effects. Neither is wrong; they are tuned differently, and knowing which way your tool leans is part of reading its output responsibly. Synthetic control gives you a defensible estimate, not a certain one.
Frameworks for GEO Attribution Specifically
GEO attribution needs its own signals because the outcome, being cited in a generated answer, is not captured by traditional rank tracking. Rather than one metric, the workable approach layers several imperfect ones into a fuller picture, since no single GEO signal is trustworthy alone.
- Direct citation tracking follows, which prompts trigger your brand's appearance in AI answers, mapping the path from a user's question to your mention.
- Crawl-log diagnostics confirm the retrieval crawlers are actually reading your updated content, which is the precondition for any citation and the first thing to check when visibility does not move.
- AI share of voice measures how often you appear in generated answers relative to competitors, giving a benchmark that trends over time. Because the engines cite largely different sources and have to be measured separately, a blended share-of-voice number hides the per-engine gaps that a causal test needs to isolate.
- Answer accuracy checks whether the engines are extracting your facts and positioning correctly, since a citation that misrepresents you is a different problem from no citation at all.
- Branded search lift looks for downstream evidence that AI visibility is prompting real people to search for you directly, which is the bridge between a citation and a purchase.
The reason to combine them is that each is individually weak. Crawl logs prove access but not citation; share of voice shows presence but not accuracy; branded search lift shows interest but cannot isolate its source. Layered, they triangulate something closer to the truth than anyone provides. This is also why a measurement dashboard has to end in a decision rather than a wall of metrics: the signals only matter once they connect to an action you can attribute. Pixis Visibility surfaces several of these, citation frequency, AI share of voice, and per-engine presence, which is the measurement side of the layered approach, though the causal work of connecting those signals to a specific intervention still requires the experimental designs above.
The Metrics and Their Limits
Credible attribution needs clean inputs, and it needs the right ones, since the metric set expanded when AI search arrived. The traditional SEO measures, organic traffic, rankings, conversions, and assisted conversions, still matter, and they now sit alongside a GEO-era set: AI visibility, AI share of voice, AI referral traffic, citation frequency, and answer accuracy.
- AI visibility and share of voice tell you whether you are present in generated answers at all, and how you compare, which is the baseline before any causal question.
- AI referral traffic shows users clicking through citations to your site, the most direct evidence that a citation produced a visit rather than just a mention.
- Citation and co-citation patterns reveal which terms and competitors you appear alongside, which describes your semantic positioning in the category.
- Branded search lift in Search Console suggests AI exposure is driving direct brand searches, a strong signal of recall.
- Business outcomes, leads, and revenue remain the measure against which everything else has to reconcile. AI share of voice doubling while revenue stays flat is a signal to revisit the strategy, not to celebrate.
The caution underneath all of them: flawed inputs produce confident-looking but wrong conclusions, so the analytics setup deserves auditing before the models run. A causal estimate is only as good as the data feeding it.
Implementing It Without Fooling Yourself
A defensible workflow follows a fixed sequence, and the sequence matters because it is what stops a team from reverse-engineering an analysis to support a conclusion it already wanted.
- Define the intervention precisely, including the exact date, scope, and nature of the change, so the timeline is clean and the thing being measured is unambiguous.
- Select metrics that map to the goal, favoring the ones tied to business outcomes over vanity numbers that move without meaning anything.
- Design the experiment to isolate the intervention, choosing a geo split, a holdout, or a synthetic control based on what the change allows, and specifying it before you look at results.
- Analyze with the uncertainty visible, reporting confidence intervals rather than point estimates alone, and refusing to treat a result inside the margin of error as a finding.
- Translate lift into value honestly, stating both the estimated effect and the confidence around it when you take it to stakeholders.
Causal findings can also feed a marketing mix model, sharpening budget allocation with experimentally grounded inputs rather than assumed ones. The through-line is intellectual honesty: the process exists to keep you from believing a result you have not earned.
The Tools, and What They Do
The core stack is modest and mostly open source. Google's CausalImpact and Meta's GeoLift, both introduced above, handle the causal modeling and geo experiment design, respectively, while GA4 and Google Search Console supply the underlying traffic, query, and conversion data. These are foundational and widely used, and neither of the causal packages requires a proprietary platform to run.
Pixis Visibility sits above the data sources on the GEO side, consolidating citation frequency, AI share of voice, and per-engine presence so the signals a causal analysis needs are in one place rather than pieced together manually. It supplies the measurement; the causal design, the counterfactual, the experiment, and the honest reading of the interval remain the analyst's work, and no tool removes that.
Why GEO Attribution Stays Hard
It is worth ending on the honest limits, because a piece about rigor should not overpromise. GEO attribution is harder than classic SEO attribution for structural reasons that will not fully resolve soon. The engines are black boxes, so you observe outputs without seeing the mechanism. The data is sparser and the metrics are newer, with less established benchmarking. And isolating a single variable is genuinely difficult when the systems synthesize many sources and change underneath you.
The direction of travel is toward better causal models, richer crawl and citation logs, and more standardized AI-search metrics, which will make this easier over time. Until then, the realistic goal is not certainty but defensible confidence: knowing which rung of the evidence ladder you are standing on, reporting the uncertainty honestly, and building the case from layered signals rather than a single clean number. That is a less thrilling promise than mathematical proof, and it is the one the methods can actually keep.
FAQ: Causal Attribution in SEO and GEO
What is the difference between correlation and causation in SEO?
Correlation means two metrics moved together; causation means one produced the change in the other. Traffic can rise after a content update, but it can also rise from seasonality, a news cycle, or an algorithm shift. Causal attribution uses a counterfactual, an estimate of what would have happened without your action, to separate the two, which observational reporting cannot do.
How do you prove visibility gains came from a specific action?
Use a design that builds a counterfactual: a holdout, a geo experiment, or a synthetic control model. You compare the treated group against a control or modeled estimate of what it would have done untouched. If the treated group outperforms that comparison beyond the range of normal noise, you have evidence of lift, reported with its confidence interval rather than as a bare number.
What is a causal evidence ladder?
It is a way of grading how strong a piece of evidence is, from observational correlation at the bottom through controlled comparisons and quasi-experimental methods up to randomized trials at the top. Its purpose is honesty: it forces you to state which rung a claim sits on rather than presenting a weak correlation with the same confidence as a controlled experiment.
Can Google CausalImpact be used for GEO measurement?
Yes, when you have a clear intervention, a stable pre-period, and good comparison data. CausalImpact estimates the effect of a change when randomization is not possible, so it can quantify shifts in visibility, citation rate, or referral traffic after an optimization. Read its output knowing that time-series methods like this tend toward declaring significance more readily than conservative geo tools, so as to corroborate important findings.
Which metrics matter most for causal attribution in GEO?
AI visibility, share of voice in AI answers, citation frequency, branded search lift, AI referral traffic, and business outcomes like leads and revenue. No single one is sufficient, since each captures a different and incomplete part of the picture. Strong attribution layers leading indicators with downstream conversion data, and reconciles everything against actual revenue.