

A developer asks whether a page is worth two days of work. You know it has problems: a weak title, thin content, a slow template. What you cannot say yet is how many extra clicks fixing them would bring, and "it should help" will not win the sprint.
Click forecasting answers that question with arithmetic most teams already have the data for. Google Search Console holds the impressions, positions and CTR. A CTR curve tells you what a better position is usually worth. The rest is subtraction.
The hard part is honesty. A forecast built on one target position and one published CTR figure looks precise and is usually wrong, especially now that AI Overviews sit above many organic results and change what a ranking is worth.
This guide walks through the four-step calculation with a worked example, the adjustments that keep it realistic, how to rank pages by upside, and how to check the forecast once the fix ships.
Key takeaways
- Projected extra clicks equal baseline impressions multiplied by the expected CTR at the target position, minus current clicks.
- Use your own Google Search Console CTR by position where you have the volume; a published curve is a fallback, not a substitute.
- Check the live results page for each main query and discount the CTR when an AI Overview or other SERP feature sits above the organic results.
- Present a conservative, expected and aggressive range, and label the assumption behind each bound.
- Pixis Visibility's page audits estimate projected traffic opportunity and its Google Search Console connection shows before-and-after impact, which helps you build the backlog and check the result.
Gather the inputs first
Each input removes one guess from the forecast. Collect them before you open a spreadsheet.
- Google Search Console history for the page, ideally at least 90 days of Performance report data, so you are not forecasting from a single good or bad week.
- A CTR benchmark. Your own site's CTR by position is best. If you lack the volume, name the published curve you are using so others can check it.
- One defined fix. A forecast for a title rewrite is not a forecast for a sitewide template change. Name the exact issue and the exact page. If you cannot name the issue yet, run an SEO audit first.
- A spreadsheet with one row per query and columns for impressions, clicks, CTR and position.
Step 1: Pull the baseline
In the Performance report, filter to the page and export the queries with their impressions, clicks, CTR and average position. Use a period long enough to smooth out weekly swings, then convert to a monthly figure.
Keep branded and non-branded queries in separate groups. Branded queries usually have much higher CTR at the same position, and mixing them in inflates the forecast for any fix aimed at non-branded demand.
Record the baseline at the top of the sheet. Every later number depends on it, and anyone reviewing the forecast should be able to see it without asking.
Step 2: Set a realistic target position
Estimate where the page could land after the fix. Base it on three things: how severe the issue is, how strong the pages above you are, and what similar fixes achieved on your site before.
Pages in positions 8 to 15 with high impressions and low CTR are usually the best candidates. They already have Google's attention, and a modest move can bring them onto page one or into the top five. A page already at position 2 has little room left, however good the fix.
Be conservative about distance. A title rewrite might move a page a few positions; it rarely takes a page from 15 to 1 against established competitors.
Step 3: Apply a CTR curve and adjust for the SERP
Take the expected CTR at your target position from your own data or the curve you named. Multiply baseline impressions by that CTR to get projected clicks, then subtract current clicks.
Build your own curve if you can
In Search Console, group your non-branded queries by average position (1 to 3, 4 to 6, 7 to 10 and so on) and calculate the CTR for each band. With enough volume, this site-specific curve reflects your titles, your brand recognition and your SERPs better than any industry average.
Discount for AI Overviews and other features
Open the live results page for the main queries. If an AI Overview, featured snippet or other feature sits above the organic results, discount the projected CTR. Ahrefs found that AI Overviews correlate with a 58% lower average CTR for the top-ranking page, based on 300,000 keywords comparing December 2023 with December 2025.
That is a correlation across a large sample, not a fixed rule for your query. Use it to justify a discount, then size the discount from your own data where you can. For more on how AI answers have changed click behavior, see AI Overviews and paid search: the CTR story already changed.
Step 4: Build a range, not a single number
Run the math three times: a conservative case, an expected case and an aggressive case. Change the target position, the CTR assumption or both, and write down what each bound assumes.
A worked example
The numbers below are illustrative. Suppose the page currently earns 12,000 impressions and 36 clicks a month (a 0.3% CTR) from non-branded queries at an average position of 11. The CTR values are illustrative too, standing in for your own curve.
- Conservative: target position 6, CTR of 0.6% with an AI Overview, 72 projected clicks, 36 extra clicks per month.
- Expected: target position 4, CTR of 1.1% with an AI Overview, 132 projected clicks, 96 extra clicks per month.
- Aggressive: target position 4, CTR of 3.7% with no AI answer, 444 projected clicks, 408 extra clicks per month.
Each scenario is 12,000 impressions multiplied by the CTR, minus the 36 current clicks. The gap between the expected and aggressive scenarios is mostly the AI Overview assumption. That spread is the honest answer: until you know whether an AI answer will sit above the result, a single number would hide the biggest uncertainty.
Watch the impressions assumption
The example holds impressions flat, which is a simplification. A page that moves from page two to page one is shown more often, so impressions may rise. Treat any impressions change as a separate, labeled assumption rather than folding it into the CTR.
Rank pages by upside per hour of work
The forecast is cheap; the fix is the expensive part. That is why the forecast exists: to keep developer and content hours away from pages with little upside.
Score each candidate by expected extra clicks divided by the effort the fix needs, and work from the highest ratio down. A simple effort scale (small, medium, large) is enough to start. If competing initiatives need a more formal comparison, a reach, impact, confidence and effort score works the same way.
Weight by scope as well. A template fix that affects hundreds of pages can outrank a single-page rewrite with a higher per-page forecast, so add the forecasts across every page the change touches.
Check the forecast after the fix ships
A forecast is only useful if you check it. After the fix goes live, wait until Google has recrawled the page and the position has settled; slow-crawled pages can take weeks.
- Compare actuals with the range. Filter Search Console to the page and target queries, and see where clicks landed relative to your conservative and aggressive bounds.
- Diagnose a miss. If position improved but clicks did not, check whether a new AI Overview or SERP feature appeared on the query. If position did not move, the target was too optimistic or the fix did not address the real issue.
- Feed the result back. Replace the assumed position and CTR with the observed ones. Over a few rounds, your curve and your sense of realistic targets improve.
For separating the effect of your fix from everything else that moves rankings in the same period, see causal pathways in SEO and GEO.
Where Pixis Visibility fits
The slow parts of this process are finding candidate pages and pulling the same before-and-after numbers every time.
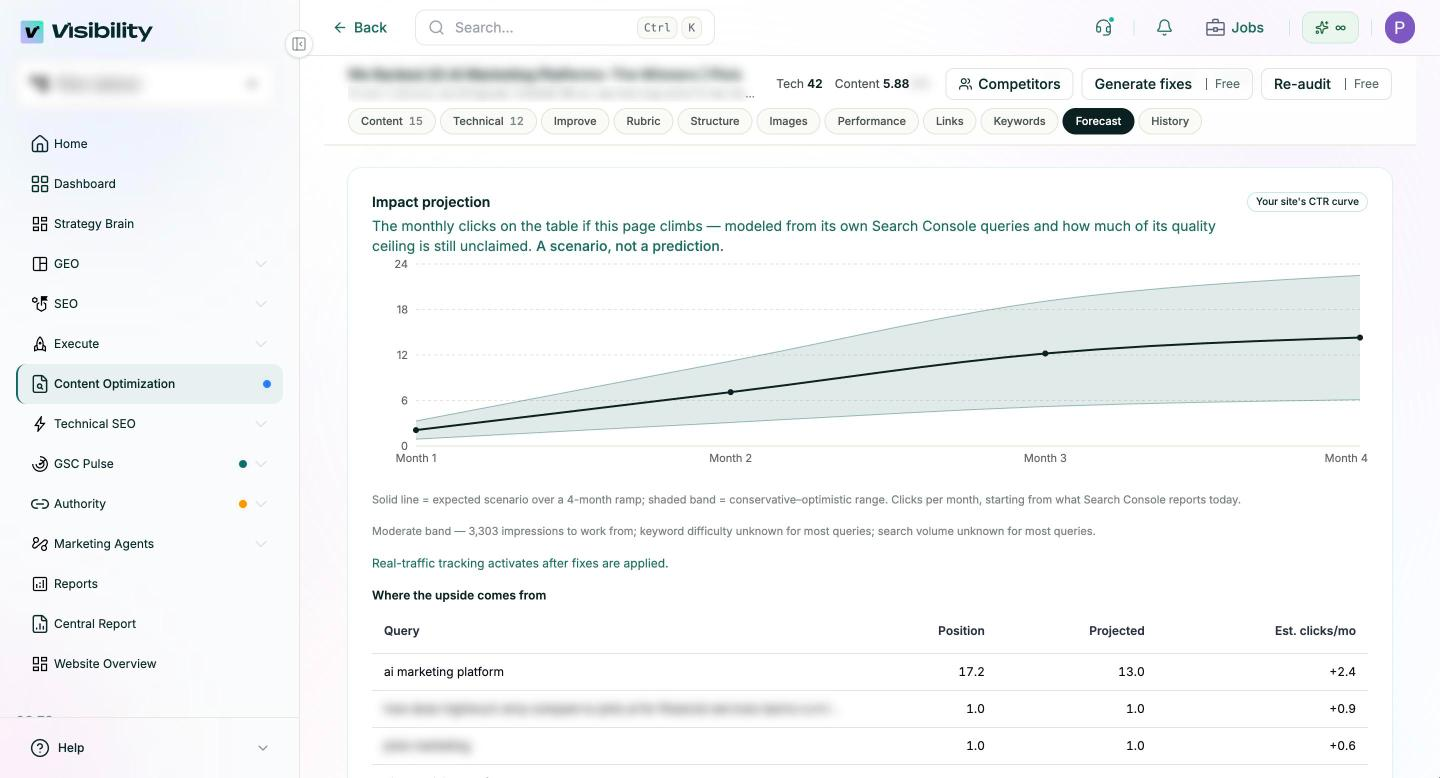
Pixis Visibility runs page audits that give each page a technical score and a content score, list the gaps with their severity, and estimate the projected traffic opportunity. That gives you a starting list of pages and named issues before you build a forecast. Its Google Search Console connection shows queries, pages and before-and-after content impact, so checking the result in the last step does not mean rebuilding the comparison by hand. Its Forecast view models the monthly clicks a page could gain from its own Search Console queries and your site's CTR curve, shows an expected scenario with a conservative to optimistic range, and lists the queries the upside comes from. Keyword position tracking shows whether the page reached the target position you assumed.
For an example of the outcome, see how Confido Health grew organic clicks by 52% with Pixis Visibility.
The forecast itself stays a judgment call. Choosing the target position, sizing the AI Overview discount and estimating effort depend on knowledge of your site and your competitors that no tool has.
Bring a range to your next planning meeting
Pick three candidate pages with high impressions and low CTR. Pull their baselines, build a curve from your own Search Console data, and write a conservative, expected and aggressive forecast for each, with the assumptions labeled.
Present the range, rank the pages by upside per hour of work, and agree on when you will check the result. A forecast that comes back inside its range builds the credibility you need for the next request.
Get started with Pixis Visibility to find pages with the largest projected traffic opportunity and measure the before-and-after impact once each fix ships.
FAQs
How many extra clicks will I get moving from position 8 to position 4?
It depends on impressions and the CTR gap. An illustrative example: if the page gets 5,000 impressions a month and your own data shows 1.5% CTR at position 8 and 4% at position 4, the move is worth about 125 extra clicks a month (200 minus 75). Discount the position 4 CTR if an AI Overview sits on the results page.
What if I do not have enough data for my own CTR curve?
Use a published curve, name it, and widen your range to reflect the extra uncertainty. As soon as you have enough non-branded volume in a position band, replace the published figure with your own.
Should branded queries be included in the forecast?
Usually not. Branded queries tend to earn high CTR regardless of the fix, and they rarely move much from on-page SEO changes. Forecast non-branded queries separately and report branded traffic as context.