

Organic clicks are up 30% on the quarter, and the slide says so in large type. Then the CFO asks the obvious question: what is that worth? A traffic chart cannot answer it, and a guess will not survive the next budget review.
Putting a dollar value on SEO gains is less about finding one perfect formula and more about showing your working. Finance does not need you to be precise. It needs a number it can reproduce from the same exports, with assumptions that lean conservative.
The trap is mixing traffic that SEO earned with traffic that would have arrived anyway. Branded searches, existing demand and last-click attribution all inflate the figure, and an inflated figure gets dismissed along with the rest of the report.
This guide covers the data you need, two valuation methods (paid-equivalent value and pipeline value), how to present them as a range on one slide, and where automation saves time each month.
Key takeaways
- Report SEO value as a range, with paid-equivalent value as the floor and pipeline-attributed revenue as the ceiling. A single number invites a single point of failure.
- Remove branded queries before either calculation, because people who search your name already know you and were not won by content.
- Discount the paid-equivalent figure. Google's Economic Impact methodology treats organic clicks as about 70% as commercially valuable as ad clicks, and borrowing that adjustment keeps your number defensible.
- Use GA4 data-driven attribution for the pipeline method so organic research visits get credit even when another channel closes the deal.
- Pixis Visibility connects to Google Search Console and tracks keyword positions and before/after content impact, which supplies the click inputs; CPCs, CRM rates and the final judgment stay with you.
Gather three inputs before you calculate
Both methods start from the same raw material. Pull it once for a fixed measurement period and label every export with its date range.
- Google Search Console. Export at least 90 days of clicks, impressions and average position at the query level. Query-level data is what lets you separate branded from non-branded terms later.
- GA4 with data-driven attribution. Google describes data-driven attribution as the model that distributes credit for conversion events based on each advertiser's account data instead of giving everything to the last click. Confirm it is the active model in your property settings before you export conversions.
- Either CPC data or CRM data. The paid-equivalent method needs average CPCs from Google Ads Keyword Planner. The pipeline method needs visitor-to-lead, lead-to-opportunity and close rates plus average deal size from Salesforce, HubSpot or a similar CRM. If your CRM stages are not clean, use the paid-equivalent method alone for now.
Remove branded traffic first
Branded queries are navigational. Someone who types your company name was going to find you, so counting those clicks as SEO value overstates what content work produced.
Google added a branded queries filter to Search Console in November 2025. It uses an AI-assisted classification system to split branded and non-branded traffic, and it is available for top-level properties with enough query volume. If your property does not qualify, build a regex filter from your brand name, common misspellings and product names. For the full setup, see how to separate branded from non-branded organic traffic in GSC.
Then separate incremental traffic from total traffic. Incremental traffic is the gain over a baseline period, and it is what leadership wants to see as the return on SEO investment. Total organic traffic includes demand that existed before your content program, so present it as context, not as the result.
Method 1: Paid-equivalent value
This method asks a simple question: what would it cost to buy the same non-branded clicks through paid search? It produces a media value, which is easy for finance to understand because it sits next to a number they already know.
Pull clicks and CPCs for the same queries
Export non-branded organic clicks by query from Search Console for your measurement period. Then look up average CPCs for those same queries in Google Ads Keyword Planner.
Read the Keyword Planner numbers carefully. Its average CPC forecast is personalized to your bid and budget settings, while the suggested bid and top-of-page bid ranges reflect what advertisers have historically paid. Pick one and use it consistently every month.
Run the calculation
An illustrative example: 12,000 non-branded organic clicks a month multiplied by an average CPC of $4.50 gives $54,000 in monthly replacement value, or $648,000 a year.
Apply a conservative discount
Organic and paid clicks are not perfectly interchangeable, and finance will say so. Google's own Economic Impact methodology treats organic clicks as approximately 70% as commercially valuable as ad clicks to avoid overstating value. Applying the same 0.7 factor to the example turns $54,000 into a conservative $37,800 a month.
This method works best as a quick benchmark against paid spend and for trending the same keyword set month over month. Its weakness is informational content: a query with no paid competition has no CPC, so it contributes nothing here however much traffic it brings.
Method 2: Pipeline value
The pipeline method traces non-branded organic sessions through to revenue using rates your business already tracks. It is usually the larger number, and it is the one that credits top-of-funnel content.
Trace the conversion path
Start with non-branded organic sessions from GA4. Apply your visitor-to-lead rate, then your lead-to-opportunity rate, then your close rate, and multiply the closed deals by your average deal size.
An illustrative example: 20,000 non-branded sessions in a quarter, a 1.5% visitor-to-lead rate, 25% of leads becoming opportunities, a 20% close rate and a $15,000 average deal. That produces 300 leads, 75 opportunities, 15 closed deals and $225,000 in attributed revenue for the quarter. Your own rates will differ; the structure is what matters.
Why this method credits informational content
Some informational queries have no meaningful paid competition, and others have a CPC that understates their role in the buying journey. The pipeline method credits organic sessions that contribute to a conversion even when another channel gets the last touch.
That only works with the right attribution model. GA4's data-driven attribution evaluates both converting and non-converting paths, so organic research and consideration visits receive credit that a last-click model would erase.
Put both numbers on one slide
Leadership does not need the attribution debate. It needs the figure, the method behind it and enough detail to trust it. A single slide with five elements covers that:
- The dollar range. Discounted paid-equivalent value as the floor, pipeline-attributed revenue as the ceiling.
- The method behind each bound, in one plain sentence each.
- The brand filter applied, shown openly so leadership can see you removed navigational traffic voluntarily.
- The measurement period and the baseline you compared against.
- A rolling trend line, built from the same calculation every month for at least six months.
To place the figure inside a wider report for executives, see how to build an SEO and GEO report for leadership.
If someone asks for ROI, use the standard formula: organic revenue minus SEO cost, divided by SEO cost, times 100. Count all costs, including salaries, agency retainers, tools, content production and link building, and calculate ROI at both ends of the range.
For a broader approach to framing performance numbers for executives, see how to translate ad performance into boardroom language. If you need to explain why a gain happened rather than what it is worth, the post on causal pathways in SEO and GEO attribution covers that separately.
Where the estimate goes wrong
Most valuations fail in review for the same few reasons.
- Optimistic assumptions. If the number looks too good, finance dismisses it before the slide is finished. Apply the 0.7 discount to paid-equivalent value and use the lower end of your conversion-rate range for the pipeline method.
- Branded clicks left in. This is the most common source of inflation, and the easiest for a skeptical reader to spot.
- A moving keyword set. If the queries you value change every month, the trend line reflects the list, not the work. Fix the set for each reporting period and document additions.
- Mixing methods across months. Switching from the CPC forecast to the top-of-page bid range, or changing attribution models, breaks comparability. Note any change on the slide.
- A number nobody else can rebuild. The test of a good valuation is that someone in finance can start from your exports and reach the same figure.
Where Pixis Visibility fits
The slow part of this process is not the arithmetic. It is pulling the same Search Console data every month, keeping the keyword set stable and showing which content changes moved the numbers.
Pixis Visibility connects to Google Search Console and brings in query and page data, including before/after views of content impact, so you can see how clicks changed after a page was updated or published. Keyword position tracking keeps the same non-branded set under watch each month, and competitor benchmarking adds organic traffic, domain authority and backlink context when leadership asks how you compare.
You can schedule custom reports so the inputs arrive on the same cadence as your valuation, and ask plain-English questions about your data when someone wants a specific cut. The Monthly Executive Summary template in Marketing Agents emails leadership a month-over-month view of organic clicks and rankings on the first of each month, showing what grew and the pages behind it.
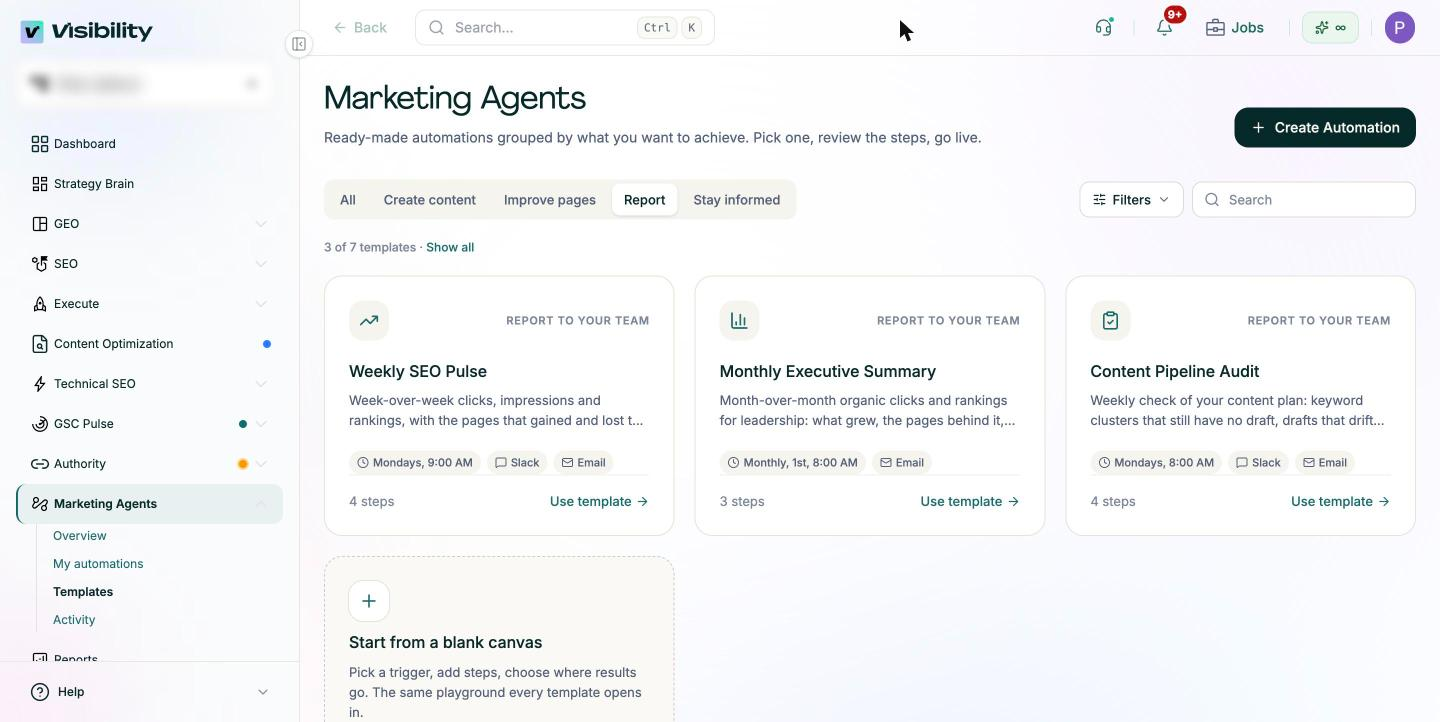
What stays manual: Keyword Planner CPCs, CRM conversion rates and deal sizes, the choice of discount and baseline, and the judgment about which gains SEO actually earned.
Make the first valuation reproducible
Start with one quarter and the paid-equivalent method, because it needs the fewest inputs. Strip branded queries, apply the 0.7 discount and write down every assumption next to the number.
Then add the pipeline method once your CRM stages are reliable, and present both as a range. Before the meeting, ask someone in finance to rebuild the figure from your exports. If they reach the same number, the method holds.
For an example of the kind of organic click growth this framework puts a value on, read the Black Propeller case study.
Get started with Pixis Visibility to keep Search Console clicks and keyword positions current for your monthly SEO valuation.
FAQs
Should I use last-click or data-driven attribution for SEO reporting?
Use data-driven attribution in GA4. Google describes it as specific to each advertiser and conversion event, using machine learning to evaluate converting and non-converting paths. Last-click models tend to erase the research visits organic search drives, which understates the pipeline value.
How often should I update the valuation?
Monthly is enough for most teams, using the same keyword set, discount and attribution model each time. Leadership learns more from six consistent months than from one detailed snapshot, because the trend line carries the argument.
Can I use this method for content that targets AI search?
Partly. Clicks from Google into your pages can be valued the same way, but answers in AI assistants often mention brands without sending a click. Report that visibility separately rather than forcing it into a dollar figure built on click data.